C2.4 Solve inequalities that involve one operation and whole numbers up to 50, and verify and graph the solutions.
Activity 1: Non-Strict Inequality Situation
Present the following scenario to the students:
Ask the students to indicate on a number line the number of minutes Nicolas could have played his video games when he came home from school.
Strategy
Represent the situation using an inequality
This morning, Nicolas played his video games for 17 minutes. We want to know how many minutes Nicolas could have played his video games after school, so 17 + m. He can play up to a maximum of 30 minutes per day.
To find the number of minutes Nicholas could have played his video games after school, we need to solve the following inequality:
17 + m ≤ 30
| m | 17 + m | ≤ 30 |
|---|---|---|
| 0 | 17 | yes |
| 1 | 18 | yes |
| 2 | 19 | yes |
| 3 | 20 | yes |
| 4 | 21 | yes |
| 5 | 22 | yes |
| 6 | 23 | yes |
| 7 | 24 | yes |
| 8 | 25 | yes |
| 9 | 26 | yes |
| 10 | 27 | yes |
| 11 | 28 | yes |
| 12 | 29 | yes |
| 13 | 30 | yes |
| 14 | 31 | no |
| 15 | 32 | no |
| 16 | 33 | no |
m ≤ 13
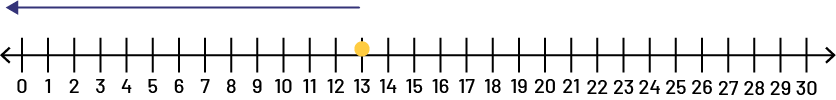
After school, Nicolas could have played his video games for 13 minutes or less. A closed dot has been placed on the number 13 to indicate that 13 is a possible value.
Ask a few groups to present their solutions. Allow students to review their answers.
Activity 2: Strict Inequality situation
Present the following situation:
Strategy
Represent the situation using an inequality
Since the number of people currently in the pool is 8 and there must be fewer than 26 people, we can represent the situation using the following inequality:
8 + n < 26
where n is the number of people
| n | 8 + n | < 26 |
|---|---|---|
| 0 | 8 | yes |
| 1 | 9 | yes |
| 2 | 10 | yes |
| 3 | 11 | yes |
| 4 | 12 | yes |
| 5 | 13 | yes |
| 6 | 14 | yes |
| 7 | 15 | yes |
| 8 | 16 | yes |
| 9 | 17 | yes |
| 10 | 18 | yes |
| 11 | 19 | yes |
| 12 | 20 | yes |
| 13 | 21 | yes |
| 14 | 22 | yes |
| 15 | 23 | yes |
| 16 | 24 | yes |
| 17 | 25 | yes |
| 18 | 26 | no |
| 19 | 27 | no |
| 20 | 28 | no |
| 21 | 29 | no |
| 22 | 30 | no |
n < 18

According to the table above, fewer than 18 people can join the other two families in the pool. An open circle has been placed over the number 18 since this is not a possible value.
Ask a few groups to present their solutions. Allow students to review their answers.