C1.2 Create and translate repeating, growing, and shrinking patterns using various representations, including tables of values, graphs, and, for linear growing patterns, algebraic expressions and equations.
Skill: Creating Growing and Shrinking Patterns
Before creating patterns, students must first recognize, compare, describe, change the representation, and extend a wide variety of patterns.
Below is an example in which students demonstrate their understanding of the concept of a rule by creating a pattern and explaining it.
When students use manipulatives to create patterns they can easily change one element of the pattern and check the rule.
Initially, teachers have students work in small groups to encourage the exchange of ideas. They can provide them with the attributes and structure of the pattern, as well as the materials required to create it.
During a mathematical discussion (consolidation/debrief), presentations of the patterns help to identify different representations of the same rule and to check how students communicate their understanding.
Next, students can be asked to create a pattern and exchange it with a peer. They can then construct a different representation of the received pattern, describe its structure, extend it, or produce a completely different one for comparison. The number of elements in the pattern should be limited, however, as some students use too many, making it difficult to understand the structure of the pattern.
Source: translated from Guide d’enseignement efficace des mathématiques de la 1re à la 3e année, Modélisation et algèbre, Fascicule 1, Régularités et relations, p. 39-40.
Example
Provide a recursive relationship of addition or subtraction (for example., +23 or -23). Have students create different patterns with this relationship and compare them.
Source: translated from Guide d’enseignement efficace des mathématiques de la 1re à la 3e année, Modélisation et algèbre, Fascicule 1, Régularités et relations, p. 63.
Skill: Translating Patterns and Making Connections Between Different Representations
When students make connections between the different representations they are deepening their understanding about a pattern. When students express their understanding of a problem situation or concept and defend their ideas using different representations they are demonstrating their algebraic reasoning.
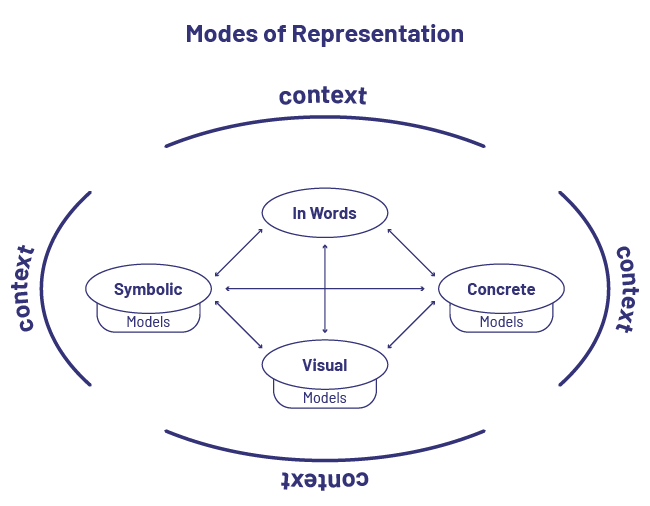
Modes of representations
- concrete, related to exploration, manipulation and creation using concrete materials;
- visual or semi-concrete, connected to an illustration, drawing or any other representation on paper;
- symbolic, linked to any representation made with numbers or symbols;
- “with words”, related to a verbal or written explanation or description.
Source: translated from Guide d’enseignement efficace des mathématiques de la 4e à la 6e année, Modélisation et algèbre, p. 18.
Contexts allows students to make connections between the various representations.
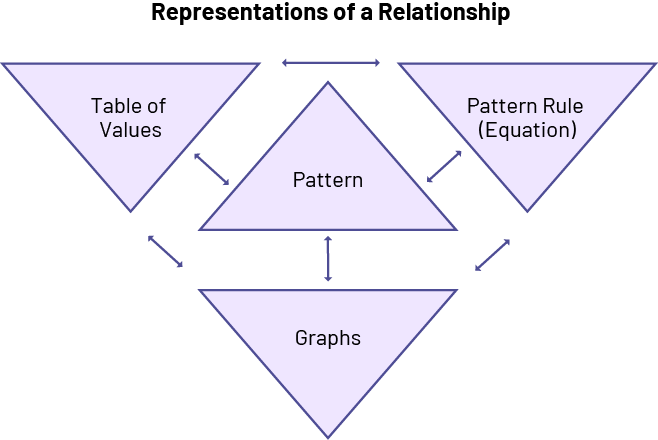
In the junior grades, students explore patterns and represent them in different ways. In Grade 6, students learn that a growing pattern can be represented by a situation (non-numeric pattern), a word rule, a table of values, or a graphical representation. The arrows in the graph below show the connections between these representations.
Source: translated from Guide d’enseignement efficace des mathématiques de la 4e à la 6e année, Modélisation et algèbre, p. 41.
Using multiple representations of the same pattern to communicate understanding is an essential component of developing algebraic thinking.
Describing a Growing Pattern
1. Representing a Repeating Pattern Using Words
The repeating pattern is composed of 4 red triangles, 2 blue squares, 4 red triangles, 2 blue squares, 4 red triangles, 2 blue squares.

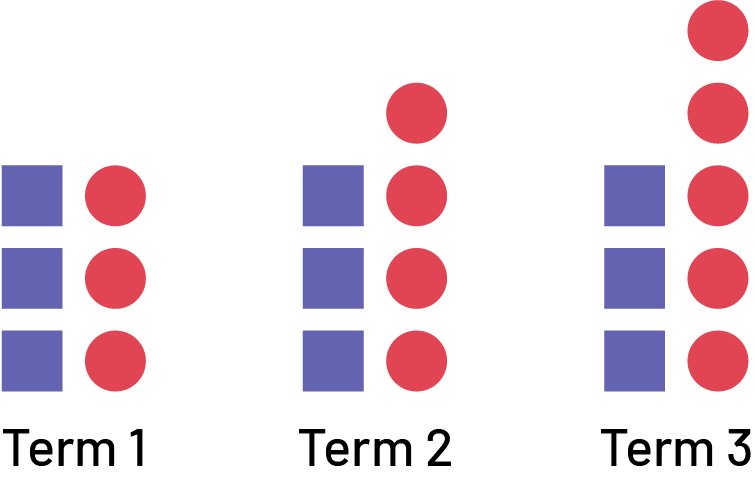
2. Representing a Growing Pattern Using Words
When students are presented with a growing pattern, teachers should provide them with a variety of opportunities to describe it in words. This is an essential step in getting students to determine the algebraic expression of the pattern.
The growing pattern can be described as follows:
- Term 1 is composed of 3 blue squares and 3 red circles.
- Term 2 is composed of 3 blue squares and 4 red circles.
- Term 3 is composed of 3 blue squares and 5 red circles.
Students may also notice that the number of blue squares, 3, remains constant, while the number of red circles increases by 1 for each term.
Manipulatives
Examples of manipulatives include algebraic tiles, nesting cubes, tokens, relational rods. Students can use them to create and explore patterns.
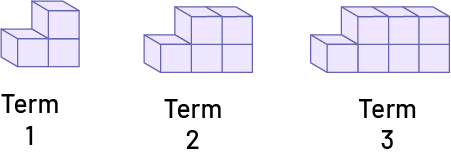
1. Representing a Growing Pattern Using ManipulativesHave students represent the 2, 6, 10, 14… number pattern in a concrete way to make the pattern rule more visible, by creating a growing pattern using manipulatives of their choice. Encourage them to add materials (cubes, tokens, etc.) in the same way from one term to the next and to rearrange them as needed.
Source: translated from Guide d’enseignement efficace des mathématiques de la 4e à la 6e année, Modélisation et algèbre, p. 212.
Relevant Questions
- How many cubes (tokens, blocks) will you use to concretely represent the first term of the pattern? The second? The third?
- What change do you notice from one term to the next?
- What remains the same from one term to another (the constant)?
- Are your cubes added the same way from one term to the next?
- How would you describe the appearance of the next term in this growing pattern?
- How many cubes will the tenth term contain? How can you determine this?
- What is the pattern rule? How do you know?
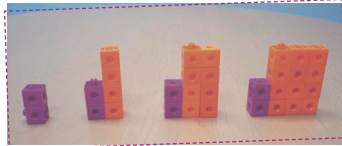
Teachers can give students the equation below and have them represent it using nesting cubes.
c = 1 + 2n
Two steps can be illustrated that lead to the representation of an equation using manipulatives, during which the emphasis is placed on the relationship between the term number and the number of cubes that compose the term.
Example of reasoning
1. Verbalize the relationship: To determine the number of cubes in a term, I start with 1 and add the term number multiplied by 2.
2. Visualize the relationship:
- Term 1 has 1 cube and 1 group of 2 cubes.
- Term 2 has 1 cube and 2 groups of 2 cubes.
- Term 3 has 1 cube and 3 groups of 2 cubes.
Source: translated from Guide d’enseignement efficace des mathématiques de la 4e à la 6e année, Modélisation et algèbre, p. 53-54.
Illustration
Drawing an illustration allows students to create a semi-concrete personal representation of their observations and understanding.
Many types of problems are naturally suited for students to draw a picture to help them solve the problem. Students may also use manipulatives at the same time.
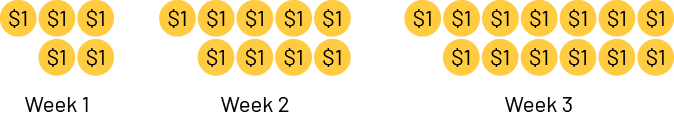
1. Representing a Growing Pattern Using an IllustrationSimon wants to buy a toy, but he doesn't have enough money in his piggy bank. His parents decide to give him the same amount of money every week, which he deposits in his piggy bank. In order to keep track of the amount of money in his piggy bank, Simon has created the following table of values:
| Weeks (Term Number) | 1 | 2 | 3 | 4 | ||
|---|---|---|---|---|---|---|
| Amount in the Piggy Bank ($) | 5 | 9 | 13 | 17 |
Ask students to illustrate the situation and determine how much money the parents give him each week.
Relevant questions
- How does the illustration help determine the pattern rule?
- How much money will Simon have in the piggy bank in week 5? How do you know?
- If Simon receives the same amount of money each week, why does he have $5 after the first week?
- How can you determine the amount in the piggy bank after many weeks have past, for example, in week 10?
- After how many weeks will Simon have enough money to buy a video game for $45 (including taxes)?
Source: translated from Guide d’enseignement efficace des mathématiques de la 4e à la 6e année, Modélisation et algèbre, p. 214-215.
2. Representing the Equation of a Linear Growing Pattern Using a Semi-Concrete RepresentationIt is also possible, for example, to represent the equation \(y = 2x + 4\) using the non-numeric growing pattern below with the first three terms:
Source: Ontario Curriculum, Mathematics Curriculum, Grades 1-8, 2020, Ontario Ministry of Education.
Table of Values
A table of values is a semi-concrete representation showing the relationship between two changing quantities (variables), one of which depends on the other. It is often constructed to represent the relationship between numerical values associated with the terms of a growing or shrinking pattern.
The table of values can also be used to present values of variables in an equation or in a problem-solving context.
1. Representing the Relationship Between Two Changing Quantities Using a Table of ValuesIn a problem-solving context, students can connect a situation expressed in words to a table of values.
Present the following situation:
To better understand this relationship, students can model it using concrete or semi-concrete materials and words.
When you rent 2 movies, there is a $4 subscription fee and 2 x $5, so you pay $14.
When you rent 3 movies, there is a $4 subscription fee and 3 x $5, so you pay $19.
When you rent 4 movies, there is a $4 subscription fee and 4 x $5, so you pay $24.
Afterwards, students can use a table of values to represent the relationship between the number of movies viewed and the amount of money spent.
| Number of Movies Rented | Amount Spent ($) |
|---|---|
| 1 | 9 |
| 2 | 14 |
| 3 | 19 |
| 4 | 24 |
| … | … |
Source: translated from Guide d’enseignement efficace des mathématiques de la 4e à la 6e année, Modélisation et algèbre, p. 51.
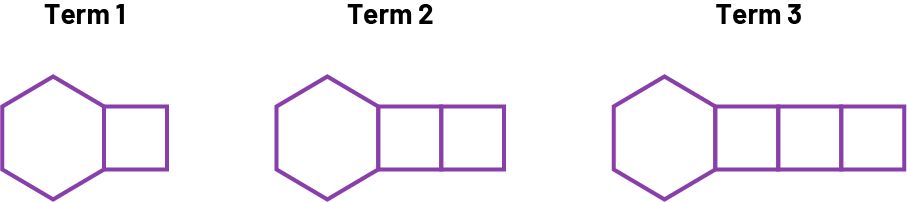
2. Represent the Relationship Between Two Changing Quantities Using a Table of ValuesPresent the following pattern:
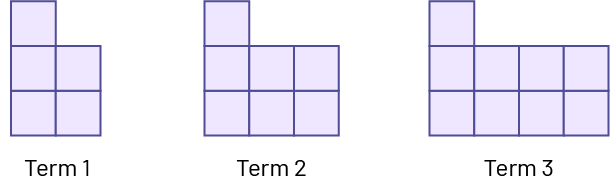
Ask students to create a table of values that represents the relationship between the term number and the number of squares.
Relevant questions:
- Describe the relationships in the table of values.
- What is the value of the next terms?
- Describe the relationship between the geometric pattern and the table of values.
- What is the constant in the pattern? (Refer to the growing geometric pattern.)
Present the equation g + k = 11 and ask students to determine the possible whole number values of g and k.
| g | 0 | 1 | 2 | 3 | 4 | 5 | 6 | 7 | 8 | 9 | 10 | 11 |
|---|---|---|---|---|---|---|---|---|---|---|---|---|
| k | 11 | 10 | 9 | 8 | 7 | 6 | 5 | 4 | 3 | 2 | 1 | 0 |
Relevant Questions:
- If g has the value of 10, what is the value of k?
- If k has the value of 8, what is the value of g?
- Can g and k have other possible values? How can you check?
- How can you organize the different possibilities in a table of values?
Source: translated from Guide d’enseignement efficace des mathématiques de la 4e à la 6e année, Modélisation et algèbre, p. 231-233.
Graphical Representation
A graph is a set of point (term number, term value) plotted on a coordinate system. In the Data strand for the junior division, students learn how to represent data using a variety of graphs. Students can use this knowledge in the Algebra strand. The appearance of the data set in a graph (for example, bars in ascending or descending order) allows for analysis of change and facilitates interpolation and extrapolation. The table of values is used to create the graph.
Here are some examples of how to use a graph:
1. Representing the Relationship Between Two Changing Quantities Using a GraphPresent the following situation:
Last Saturday, during the marathon, Louis and Gaëlle sold lemonade. After each pitcher they sold, they counted the money they had received. The table of values below represents the relationship between the number of pitchers sold and the amount of money collected.
| Number of Pitchers Sold | 1 | 2 | 3 |
|---|---|---|---|
| Amount Collected ($) | 4 | 8 | 12 |
Then graph the data as shown below:
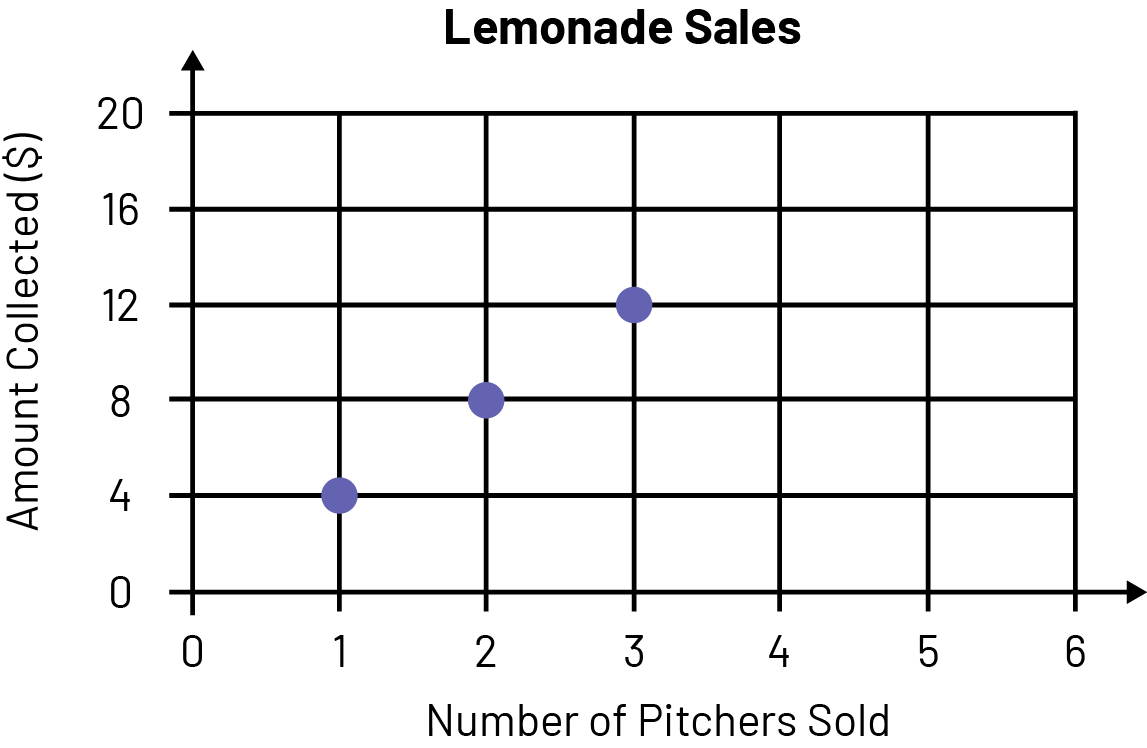
Source: translated from Guide d’enseignement efficace des mathématiques de la 4e à la 6e année, Modélisation et algèbre, p. 233.
Relevant Questions
- What changes occur from one pitcher sale to the next? Are these changes always the same? Why do they change?
- Looking at the graph, how is it possible to determine how much money they will have collected after selling an additional pitcher of lemonade?
- What is the relationship between the number of pitchers sold and the amount collected?
- How can the first three values shown in the graph help determine the amount of money collected after eight pitchers are sold?
- How many pitchers should they sell if they want to get about $50?
Skill: Representing Linear Growing Patterns Using Equations or Algebraic Expressions
The described learning progression reflected in the mathematics curriculum content and research, including Lee (1996, p. 105), suggests three steps that lead to representing a growing non-numerical pattern using a rule:
- Visualize the relationship: perceive the terms in a certain way and recognize a connection between them.
- Verbalize the relationship: use what has been perceived to state a pattern rule in everyday language.
- Represent the relationship using symbols: express the pattern rule using an equation made up of variables and constants.
These three steps to developing an equation can be illustrated using the non-numerical pattern below, where the relationship between the term number and the number of cubes in it is explored (the functional relationship).
Source: translated from Guide d’enseignement efficace des mathématiques de la 4e à la 6e année, Modélisation et algèbre, p. 53.
Possible reasoning of the student
- Visualize the relationship:
In the 1st term, there is 1 cube and 1 group of 2 cubes.
In the 2nd term, there is 1 cube and 2 groups of 2 cubes.
In the 3rd term, there is 1 cube and 3 groups of 2 cubes.
So, in the 10th term, there will be 1 cube and 10 groups of 2 cubes.
- Verbalize the relationship:
To determine the number of cubes in a term, I start with 1 and add the term number multiplied by 2.
- Represent the relationship using symbols:
The student concludes that the relationship can be represented by the equation c = 5 +(n - 1) × 2, where n is the term number and c is the number of cubes in it.
This relationship can be confirmed by creating a table of values and a graphical representation of the linear growing pattern.
| Term Number (n) | Number of Cubes (c) |
|---|---|
| 1 | 3 |
| 2 | 5 |
| 3 | 7 |
| n | \(\ 1 + 2n \) |
Note: In Grade 6, students learn to perform arithmetic operations using order of operations. The equations presented in this document to express a rule reflect this knowledge.
It is important to recognize that the path to the expression of a matching rule may differ from person to person, since reasoning develops from individual perceptions. The example below, inspired by research conducted by Radford ("Algebraic thinking and the generalization of patterns: a semiotic perspective", in J. L. C. S. Alatorre, M. Sáiz, A. Méndez (Eds.), Proceedings of the 28th Conference of the International Group for the Psychology of Mathematics Education, North American Chapter, vol. 1, Mérida, Mexico, 2006, pp. 2-21, as cited in Ontario Ministry of Education, A Guide to Effective Instruction in Mathematics, Grades 4-6: Modeling and Algebra, 2008, p. 54), illustrates how students may perceive the relationship between the term number and the term value (number of circles).
Example
Student 1 sees 2 rows of circles. In the top row, there is always 1 more circle (in blue) than the term number, and in the bottom row, there are always 2 more circles (in gray) than the term number.
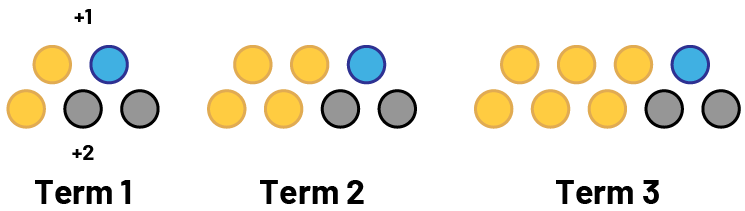
Continuing the analysis, the student determines that the 10th term will contain (10 + 1) + (10 + 2) circles, or 23 circles. The student then concludes that the relationship can be represented by the equation c =(n + 1) +(n + 2), where n is the term number and c is the number of circles in it.
Student 2 finds the total number of circles by adding the term number twice and adding 3. So, for the total number of circles in the 1st term, the number sentence is 1 + 1 + 3 = 5; for the 2nd term, 2 + 2 + 3 = 7; and for the 3rd term, 3 + 3 + 3 = 9.

As the student continues their analysis, they conclude that the relationship can be represented by the equation \(c = n + n + 3\), where n is the term number and c is the number of circles in it.
Student 3 sees:
- in the 1st term, 5 circles;
- in the 2nd term, the 5 initial circles, to which we added 1 group of 2 circles,
- in the 3rd term, the 5 initial circles, to which we added 2 groups of 2 circles.

Analyzing these observations, the student generalizes and determines that in each term there are 5 circles and a number of groups of 2 circles, this number corresponding to the previous term number. Thus, in the 25th term, there will be \(5 + 24 \times 2\) circles, or 53 circles.
Note: Students may present their interpretation using a chart.
| Term Number | Number of Circles | Explanation Using the Recursive Relationship | Explanation Using the Functional Relationship |
|---|---|---|---|
| \(\ 1\) | \(\ 5 \) | \(\ 5 \) | \(5 + 0 \times \; 2\) |
| \(\ 2\) | \(\ 7\) | \(\ 5 + 2 \) | \(5 + 1 \times \; 2\) |
| \(\ 3\) | \(\ 9\) | \(\ 5 + 2 + 2 \) | \(5 + 2 \times \; 2\) |
| \(\ 4\) | \(\ 11\) | \(\ 5 + 2 + 2 + 2 \) | \(5 + 3 2\) |
| \(\ 25\) | ? | \(5 + 2 + 2 + 2 + … \) | \(5 +24 \times \; 2\) |
| n | \(5 + (term\;\;number - 1) \times \; 2\) | \(5 + (n - 1) \times \; 2\) |
The student concludes that the relationship can be represented by the equation c = 5 +(n - 1) × 2, where n is the term number and c is the number of circles in it.
Note: The student analyzed the recursive relationship (that is, adding 2 circles to the previous term), which leads her or him to the functional relationship using the expression n - 1 to represent the previous term number, the initial 5 circles, and a number of groups of 2 circles, namely, 5 + (n - 1) × 2.
The pattern rules formulated by the three students came from their understanding of this relationship. Each student has perceived and generalized the situation in his or her own way, resulting in three rules expressed in different, but equivalent, words. None is better than the other. They do, however, demonstrate that students' interpretation of a relationship has an effect on the pattern rule they formulate. It is important for teachers to encourage these different formulations of a pattern rule.
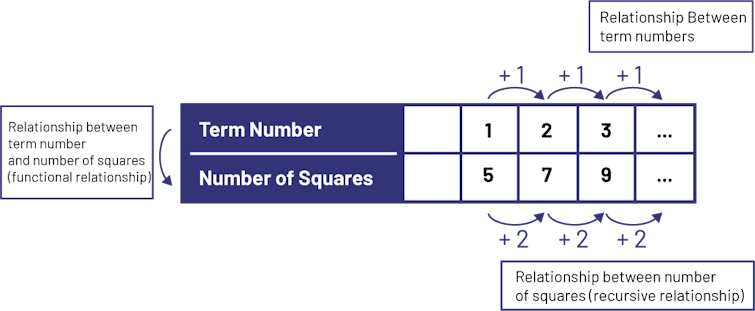
There may be students who move too quickly from the non-numeric pattern to the corresponding table of values. Starting with the previous non-numeric pattern, for example, they can immediately establish the following table.
| Term Number (n) | 1 | 2 | 3 |
|---|---|---|---|
| Number of Circles (c) | 5 | 7 | 9 |
Students then proceed by trial and error to determine the equation that defines the relationship, as evidenced by the two students' explanations. In each case, the depth of these students' understanding of the resulting equation and the relationship it represents should be questioned.
Student 4 explains that she represented the relationship using a table of values. She compared the term number to the corresponding number of circles by making several attempts. For example, she started with "× 2," but that didn't work; then she tried "× 3," but that didn't work either. She continued in this way and found that in each case it was "times two plus three" or double the term number, plus 3.
The student concludes that the relationship can be represented by the equation c = n × 2 + 3, where n is the term number and c is the number of circles that make up each term.
Student 5 explains that in the 2nd row of the table, there is a regularity, because from one term to the next, 2 is added. So in the rule, there is "x 2". They try the n × 2 rule and do not get the terms 5, 7, 9… They then try the \(n \times 2 + 1\) rule, then the \(n \times 2 + 2\) rule. When they try the rule \(n \times 2 + 3\), they get the terms 5, 7, 9…
The student concludes that the relationship can be represented by the equation c = n × 2 + 3, where n is the term number and c is the number of circles that make up each term. In this case, the student appears to determine the equation by following a memorized approach.
Teachers should consider the different ways that students perceive the relationships between terms in a pattern, and adapt their questions accordingly to help each student accurately express the rule in words and determine the corresponding equation.
Source: translated from Guide d’enseignement efficace des mathématiques de la 4e à la 6e année, Modélisation et algèbre, p. 53-57.
Technology
Technology can be used to represent, create and analyze growing patterns. The dynamic aspect of technology can support students with developing their algebraic reasoning as they explore how these representations and the relationship between two variables can change when values are altered.
Source: translated from Guide d’enseignement efficace des mathématiques de la 7e à la 10e année, Fascicule 2, Algèbre, p. 15-16.
Knowledge: Table of Values
The table of values is a numerical representation of the relationship between two variables, in which one variable is independent and the other variable is dependent. By the end of the primary grades, students have learned to create tables of values to represent relationships in problem situations.
The table of values is often created to represent the functional relationship between two numeric values associated with a non-numeric growing pattern: the term number and the corresponding value of the terms.
Example
It is possible to study the relationship between the position of a term in a growing pattern and the number of objects that compose it. The position of the term is written in the first column (or row) and the number of objects that make up the term (term value) is written in the second column (or row). The regularity rule of the terms in the second column (or row) can be used to extend the table of values.
The table of values can be arranged vertically or horizontally and is separated into columns or rows. It is a good idea to vary the layout of the table of values so that students get used to both layouts.
Vertical Table of Values
| Term Number | Number of Elements |
|---|---|
| 1 | 2 |
| 2 | 4 |
| 3 | 6 |
| 4 | … |
Horizontal Table of Values
| Term Number | 1 | 2 | 3 | … |
|---|---|---|---|---|
| Number of Elements | 2 | 4 | 6 |
Source: translated from Guide d’enseignement efficace des mathématiques de la 4e à la 6e année, Modélisation et algèbre, p. 231.
Knowledge: Graphical Representation
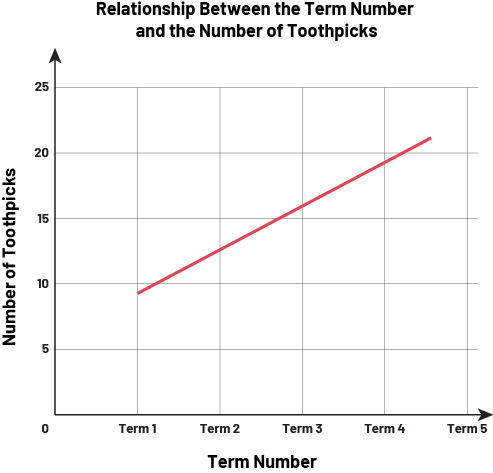
The term numbers are represented on the horizontal axis. The term value is represented on the vertical axis. The term value for term 0 is a point on the vertical axis.
Source: translated from Guide d’enseignement efficace des mathématiques de la 7e à la 10e année, Fascicule 2, Algèbre, p. 63.
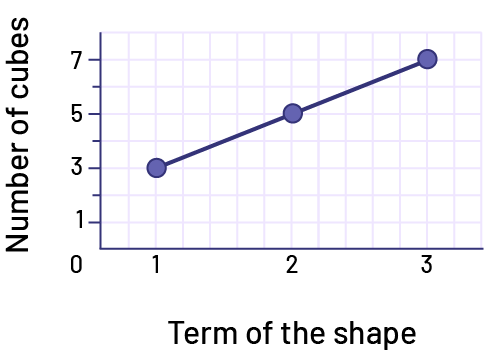
Example
Relationship between the term number and the number of toothpicks to create each figure (term value) is shown in the graph below:
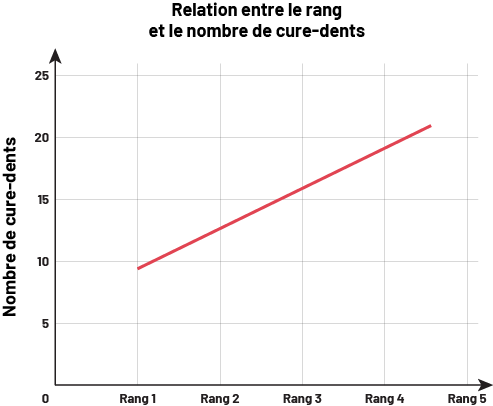
Source: translated from En avant les maths!, 6e année, CM, Algèbre, Habiletés liées aux relations dans les suites, p. 5.
Knowledge: Numerical and Algebraic Expressions
Numeric expression: An expression containing only numbers, for example 5 – 2.
Algebraic expression: A collection of one or more terms involving variables, numbers, and operations.
- Example 1: 3ab is an algebraic expression with one term where the numbers and the variables are linked by the operation of multiplication.
- Example 2: a + 4 has two terms where the number 4 and the variable a is liked by the operation of addition. Terms are separated by the operations of addition and subtraction.
Source: Ontario Curriculum, Mathematics Curriculum, Grades 1-8 , 2020, Ontario Ministry of Education.
Knowledge: Equation
An equation is a symbolic way of representing an equality. In the junior grades, students encounter four types of equations:
- Equation with one variable: An equation such as 2 + n = 14 is solved to determine the value of the variable that makes the equation hold true.
- Equation with two variables: An equation such as c = 2n + 3 is used to express a relationship, such as the relationship between the term number (n) and the term value (c). The values for c are dependent on the values for n. This equation has multiple solutions.
- Equation that is a formula: A formula such as A = c × c can be used to represent the area (A) of any square, where c represents the side length. The area of a particular square can be determined by substituting a side length into the formula. The side length of a particular square can be determined by substituting the ara for that square into the formula.
- Equation that generalizes a property situation: The equality relationship between adding any two identical numbers and multiplying that number by two can be expressed using the equation n + n = 2 × n. This equation can be verified by testing that the equation holds true for various values of n, such as 4 + 4 = 2 × 4.
Note: The details of the various types of equations are given in order to recognize that algebraic concepts are not encountered and treated exclusively in the context of modeling and algebra activities. For example, equations that are used as formulas in measurement are regularly found. However, in the junior grades, students do not necessarily have to distinguish between these types of equations.
Source: translated from Guide d’enseignement efficace des mathématiques de la 4e à la 6e année, Modélisation et algèbre, p. 89.