C1.1 Identify and compare a variety of repeating, growing, and shrinking patterns, including patterns found in real-life contexts, and compare linear growing patterns on the basis of their constant rates and initial values.
Skill: Identifying and Comparing a Variety of Patterns
When students justify their reasoning, it requires students to understand the special characteristics of various patterns. The following questions that can help guide understanding of their characteristics or how a pattern is structured.
For a repeating pattern
- Which attribute(s) are being repeated (e.g., colour, size, shape)?
- What elements make up its pattern core?
- Does the pattern repeat in multi-dimensional ways or just in one way (e.g., vertically, horizontally, diagonally)?
For growing and shrinking patterns
- Is there an element that changes from one term to the next?
- Is there an element that is constant from one term to the next?
- What is the relationship between the term number and the term value?
- Is the graphical representation linear or non-linear?
The following are questions that you can ask students when they are comparing patterns.
Sample Questions
- How can you represent these two patterns differently?
- What do you notice about the two patterns that are represented in the table of values? as a graphical representation?
- Are there any elements and/or numbers that are a part of both of the patterns?
- How does the relationship between the term number and the term value differ between these two growing patterns?
- How are these patterns similar?
- How do these patterns differ?
Source: translated from Guide d’enseignement efficace des mathématiques de la maternelle à la 3e année, Fascicule 1, Régularités et relations, p. 59-60.
Comparing Growing Patterns
In this example two growing patterns are being compared. You can also have students compare a growing pattern with a shrinking pattern where one of the patterns is increasing and the other pattern is decreasing.
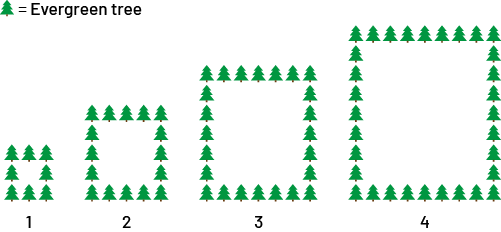
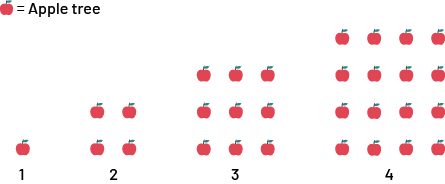
The diagram below shows that the number of evergreens and apple trees both increases from one term to the next. The pattern of the evergreen trees is linear and the pattern of the apple trees is non-linear.
This can be illustrated with tables of values and graphical representations.
- Table of values
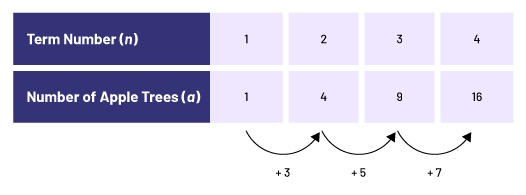
From a table of values, a growing pattern can be said to be linear or non-linear by determining the change in the term values ("+3, +5, +7" shown above). If the change is not constant, as it is the case here, the growing pattern is non-linear.
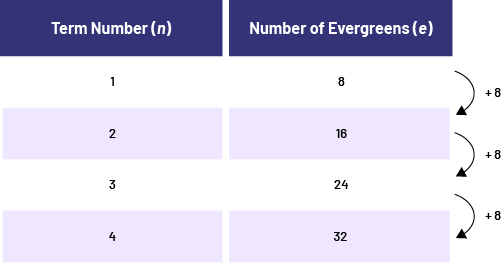
From a table of values, a growing pattern can be identified as linear or non-linear by determining the change in the term value ("+8, +8, +8" shown above). If the change is constant, as it is the case here, the growing pattern is linear.
- Graphical representations
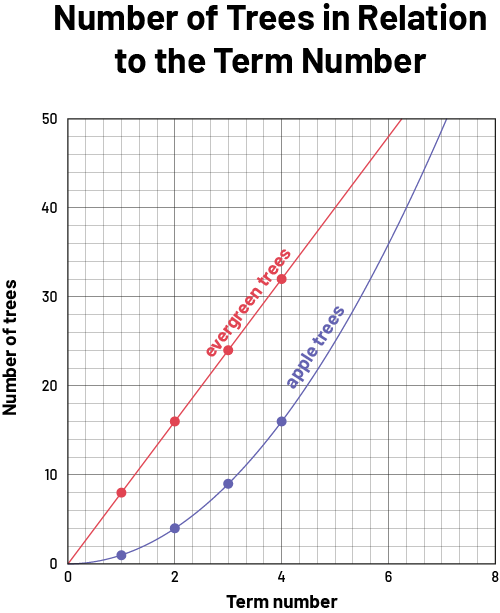
In this case, the student should be able to note that the number of apple trees in each position represents a growing pattern that is non-linear and begins at 0 for term 0. This is non-linear, since the number of apple trees does not grow at a constant rate. In the table of values, as the term number increases by 1, the number of apple trees increases by an increasing constant rate (+3, +5, +7) . It produces a curved line in its graphical representation.
The number of evergreens would also start at 0. In the table of values, each time the term number increases by 1, the number of conifers always increases by 8. This relationship is therefore a linear growing pattern, as it increases with a constant rate of 8 conifers per position. Its equation is represented by c =8n. Its graph represents a straight line in the Cartesian plane.
Source: translated from Guide d’enseignement efficace des mathématiques de la 7e à la 10e année, Fascicule 2, Algèbre, p. 15-16.
Shrinking patterns, such as the number of treats left in a container after each removal, can be presented in a similar way.
Skill: Comparing Linear Growing Patterns According to Their Constant Rates and Initial Values
When comparing linear growing patterns, we compare their constant rate as well as their initial value.
If the ratio of the change in one variable to the change in another variable is equivalent between any two sets of data points, then there is a constant rate. An example of a real-life application of a constant rate is an hourly wage of $15.00 per hour.
Source: Ontario Curriculum, Mathematics Curriculum, Grades 1-8, 2020, Ontario Ministry of Education.
In a comparison of linear growing patterns, the pattern that has the greatest constant rate grows at a faster rate than the others and has a steeper incline as a line on a graph. For example, this is true for a constant rate of 3 compared to a constant rate of 2.
Constant rate of 3:
Constant rate of 2:
Source: translated from En avant, les maths!, 7e année, CM, Algèbre, p. 5.
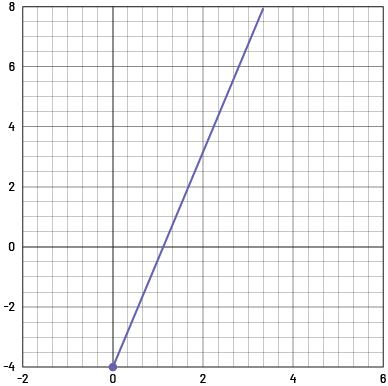
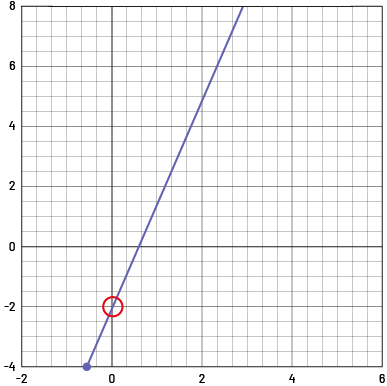
When representing a linear pattern graphically, the initial value corresponds to the value of y when x is 0.
Example
The initial value of the linear growing pattern \(y = 3x - 2\) is \(-2\), since when \(x = 0\), \(y = -2\).
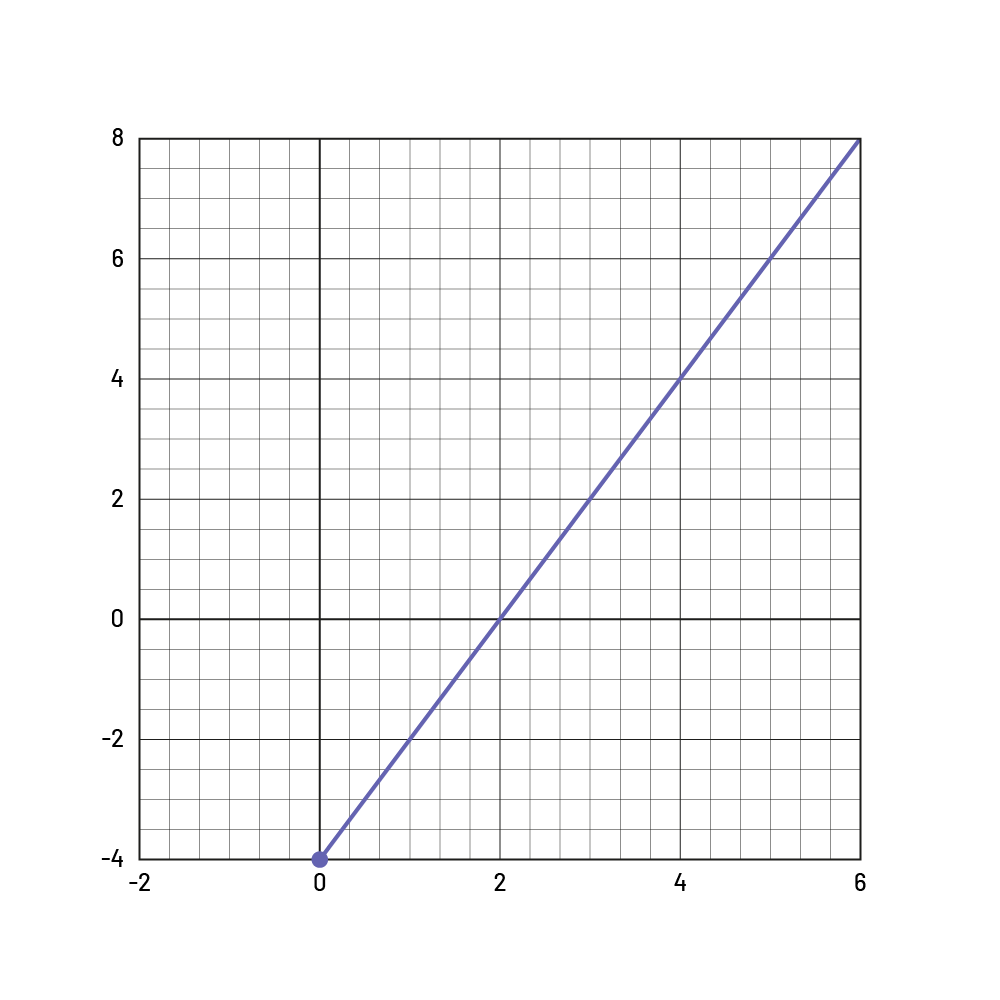
Note that the graph of a linear growing pattern that has an initial value of zero passes through the origin at \((0, 0)\).
Knowledge: Geometric Pattern
Set of shapes or objects arranged according to a pattern rule.
Repeating Pattern
A set of figures or objects arranged in an orderly fashion, in which a repeated pattern (pattern core) can be found.
Example

Growing Pattern
A set of figures or objects arranged in which the number of elements increases one term to the next.
Examples
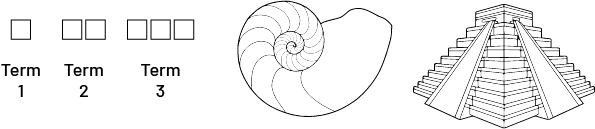
Example 1 shows a growing pattern in which 1 square is added to each subsequent term.
Example 2 shows a spiral shell, whose 1st term (basic pattern) is the first spiral in the centre of the shell. The other terms are obtained according to a certain regularity (often associated with the Fibonacci pattern and the golden ratio). The pattern formed by the different spirals is a growing pattern because the size of the spirals increases according to a pattern rule.
Example 3 represents a pyramid, whose first term is a rectangular prism at the top, to which are added blocks whose base area grows according to a certain pattern rule.
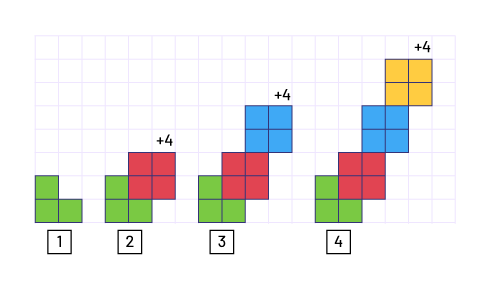
Linear Growing Pattern
A pattern that increases (grows) by a value that remains constant. In a coordinate system, it is represented as a straight line.
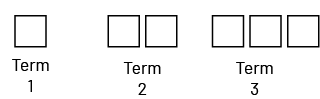
Examples
Starts with three tiles in position 1 (constant) and, for each subsequent term, it increases by four tiles:
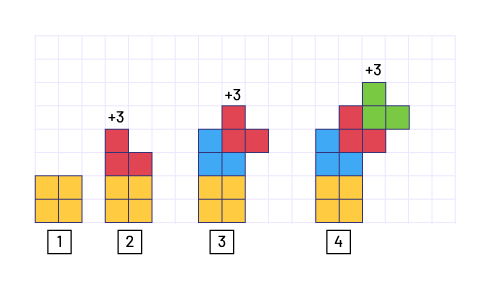
Starts with three tiles in position 1 (constant) and, for each subsequent term, it increases by three tiles:
Source: Ontario Curriculum, Mathematics Curriculum, Grades 1-8 , 2020, Ontario Ministry of Education.
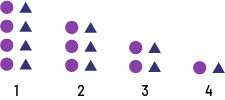
Shrinking Pattern
A geometric pattern that involves a decrease in the number of elements from term to term (e.g., 4 circles, 4 triangles, 3 circles, 3 triangles, ...).
Example

The above pattern starts with 4 purple circles and 4 blue triangles in term 1, and each subsequent term decreases by one blue triangle (-1, -2).
Linear Shrinking Pattern
A pattern in which the value of the elements, which can be represented by y, decreases as the term number, represented by x, increases. The rate of change is constant, but it has a negative value.
Knowledge: Number Pattern
Growing Number Pattern
A pattern where the terms are numbers that grow (increase). The terms of a growing number pattern come from regularities involving addition and multiplication.
Examples
- 4, 6, 8, 10... (The recursive relationship in this pattern is to add 2 to a term in order to obtain the next term).
- 1, 2, 4, 7, 11… (The recursive relationship in this pattern is to add 1 more than the previous time to get the next term).
- 3, 9, 27, 81… (The recursive relationship for this pattern is to multiply a term by 3 to get the next term).
Shrinking Number Pattern
A pattern where the terms are numbers that decrease by repeating subtraction of a positive or repeating multiplication by a factor between zero and one.
Examples
- 14, 11, 8… (The recursive relationship for this pattern is to subtract 3 from the value of a term to get the next term).
- 144, 72, 36… (The recursive relationship for this pattern is to divide the value of a term by 2 to get the next term).
Knowledge: Pattern Core
Composition of the least number of elements in a pattern from which a pattern rule can be created.
Repeating Pattern
The pattern core is:
Growing Pattern
The pattern core is:

By examining each of the terms in a pattern, we can recognize that they are created by building on the pattern core, since we can see the core within each term.
Knowledge: Attribute
A characteristic that describes an object that is observed or manipulated. Attributes can include colour, shape, texture, thickness, orientation, materials, motion, sounds, objects, or letters. The attributes that describe Pattern A below are shape and colour.
Source: adapted from the Ontario Curriculum, Mathematics Curriculum, Grades 1-8, 2020, Ontario Ministry of Education.

Knowledge: Term
A term or a position number in a pattern is comprised of at least one value or element (e.g., shape, object, or motion).
Repeating Pattern
In the following pattern, each of the shapes is a term.
1st term:

2nd term:

3rd term:

Growing Pattern
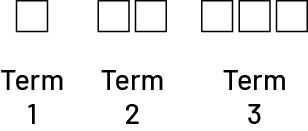
In the following pattern, each of the shapes is a term.
1st term:

2nd term:
3rd term:

Shrinking Pattern
In the following pattern, each of the shapes is a term.
1st term:

2nd term:

3rd term:

Growing Number Pattern
2, 4, 6, 8… (1st term is 2, 2nd term is 4, 3rd term is 6, etc.)
4, 10, 16, 22, 28… (1st term is 4, 2nd term is 10, 3rd term is 16, etc.)
Shrinking Number Pattern
21, 14, 7… (1st term is 21, 2nd term is 14, 3rd term is 7, etc.)
72, 60, 48… (1st term is 72, 2nd term is 60, 3rd term is 48, etc.)
Knowledge: Recursive Relationship
A description of the relationship between one term and the next, based on a generalization about the pattern structure.
Example
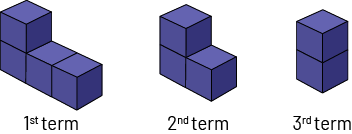
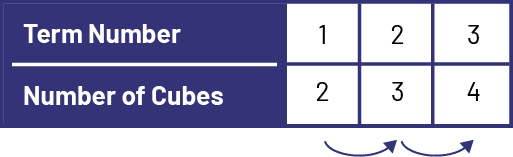
Recursive relationship: a cube is always added to the bottom row of the previous term.
Knowledge: Functional Relationship
A description of the relationship between two variables, the term number and the value of the corresponding term, based on a generalization about the pattern structure.
In the following, the functional relationship is that the number of triangles in the term is 3 times its term number.
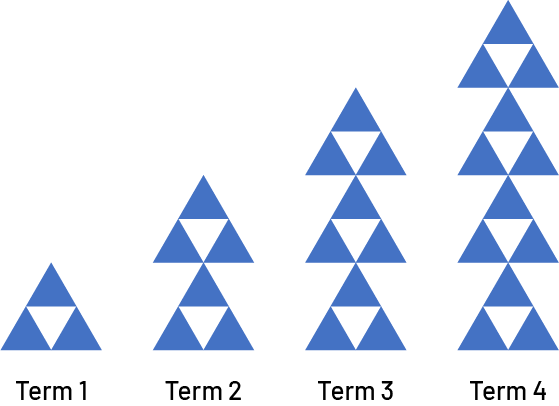

The number of triangles is equal to three times the term number: \(t = 3n\) .
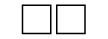
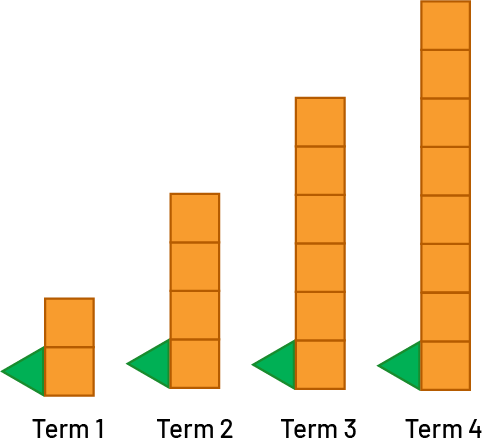
In this next pattern, the green triangle is constant from one term to the next and the number of groups of 2 orange squares corresponds to the term number.
|
In term 1, there is 1 green triangle and 1 group of 2 orange squares. In term 2, there is 1 green triangle and 2 groups of 2 orange squares. In term 3, there is 1 green triangle and 3 groups of 2 orange squares. In term 4, there is 1 green triangle and 4 groups of 2 orange squares. |
The number of shapes (s) is equal to 2 times the term number (n) plus 1: s =2n + 1.
Knowledge: Structure
Letters representing the pattern rule of a repeating pattern.
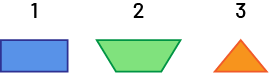
In Pattern A, each element of the pattern can be identified by a letter as follows: blue rectangle (A), green trapezoid (B), orange triangle (C). The structure of Pattern A is therefore ABC.
Knowledge: Constant Rate
If the rate between two variables in a data set is consistent throughout, then that data set has a constant rate.
Example
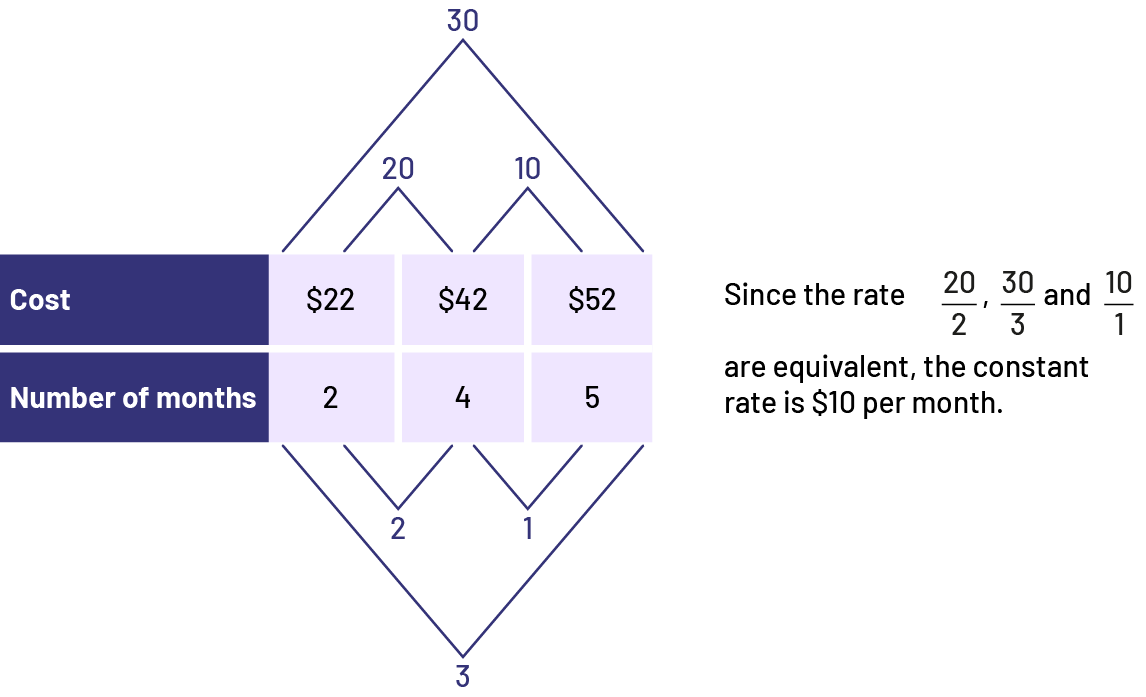
Source: translated from En avant, les maths!, 7e année, CM, Algèbre, p. 3.
Knowledge: Initial Value
The initial value of a linear growing pattern is the value of the term when the term number is zero.
Example
In this situation, the initial value is $15, since this is the value of y when x is 0.
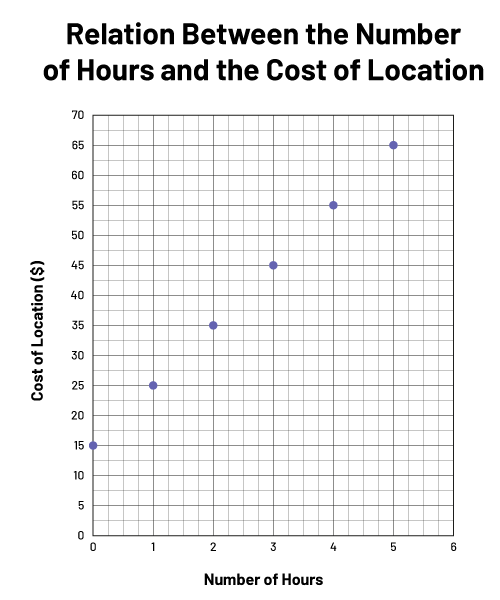
Source: translated from En avant, les maths!, 7e année, CM, Algèbre, p. 4.