C1.3 Determine pattern rules and use them to extend patterns, make and justify predictions, and identify missing elements in growing and shrinking patterns involving rational numbers, and use algebraic representations of the pattern rules to solve for unknown values in linear growing and shrinking patterns.
Skill: Determining and Using Rules to Extend Patterns, Making and Justifying Predictions, and Finding Missing Elements
Describing pattern rules in everyday language is an important step in the development of algebraic thinking.
Patterns can be described using functional thinking and recursive thinking. Describing the relationship between the term number and the term value is functional thinking. For example, each term has a value that is twice its term number. Recursive thinking can be used to make near predictions. Functional thinking tends to be used to make far predictions, such as what is the 25th term?
Students learn to use an equation to represent a functional relationship expressed in words. They must choose the
variables and formulate an equation that represents the pattern rule, which helps develop a sense of symbols. It is in
this context that the resulting equations and the relationships they represent become meaningful.
Source: translated from Guide d’enseignement efficace des mathématiques de la 4e à la 6e année, Modélisation et algèbre, p. 52.
Some pattern rules can be used to reinforce students' sense of number while developing their algebraic thinking. Contextual situations are best used because they are less abstract. Situations can feature a variety of pattern rules.
Here are some examples:
Example
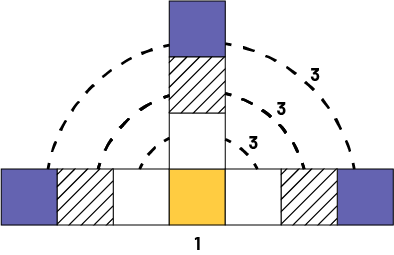
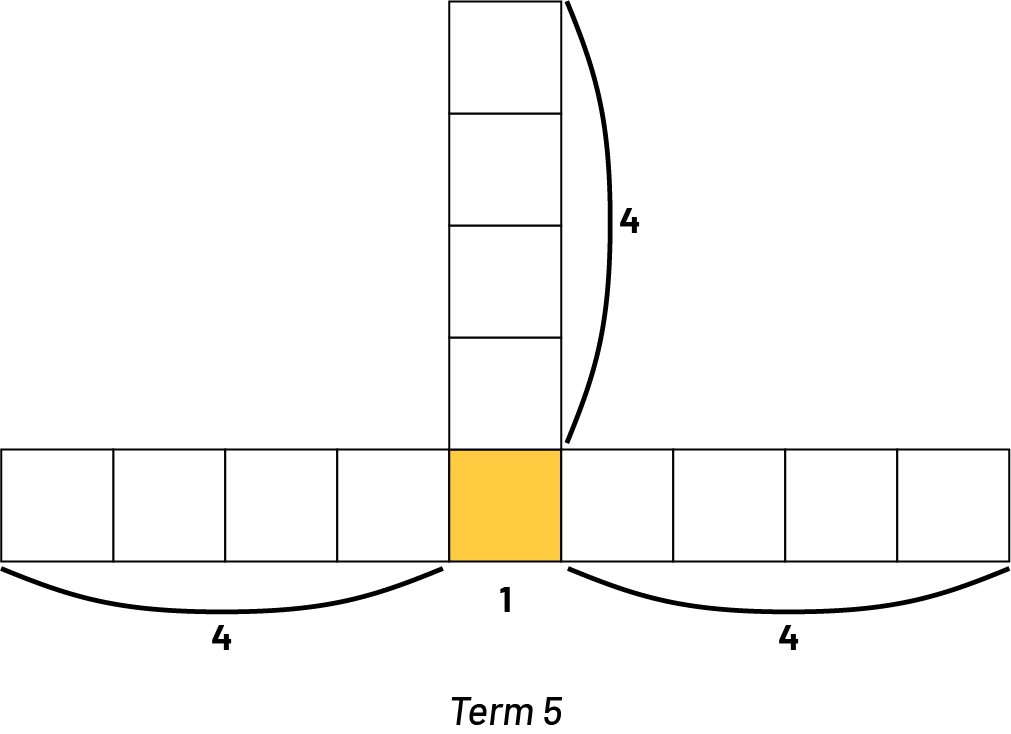
Present the following pattern.
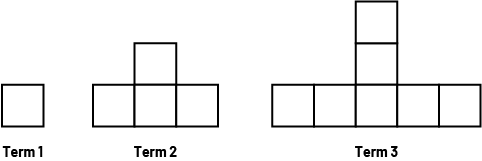
Using the following questions, encourage students to analyze the pattern and relate the term number with the number of squares it has:
- How many squares does term 1, 2, and 3 have?
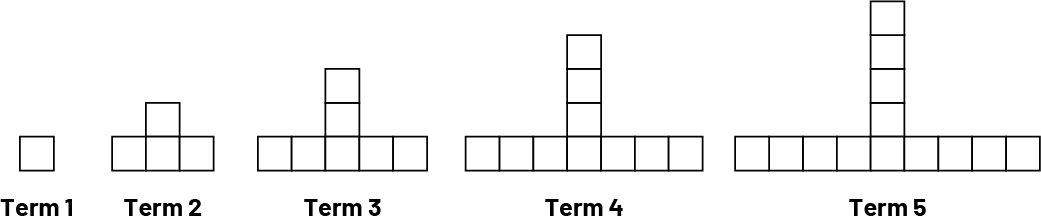
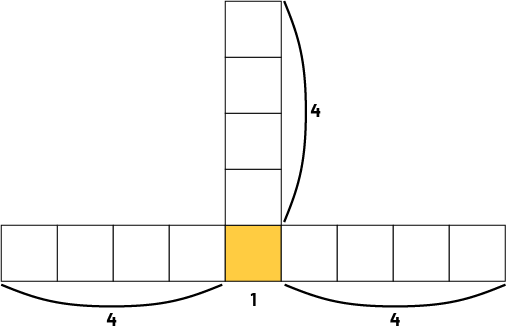
- How many squares are needed to construct term 4 ? Construct this term.
- How many squares are needed to construct term 5 ? Construct this term.
- What pattern rule can be used to determine the number of squares?
- Represent the relationship between the term number and the number of squares in each term using a table of values. What patterns do you notice in the table?
- How many squares will term 6 have? term 10 ? How do you know?
- What is another way this can be determined?
Then facilitate a mathematical discussion that focuses on students' different perceptions of the relationship. Ask them questions, such as the ones below, to get them to explain and verbalize their strategy and rule.
- What strategy did you use to count the number of squares in the 4th term?
Student 1: "For term 4, I see that there are three squares on the left, three squares on the right, three squares at the top and one square in the middle, at the bottom. That's 3 + 3 + 3 + 1, or 10 squares."
- Who used the same strategy? Did anyone use a different strategy?
Student 2: "I used a similar strategy. I see 1 square in the centre, and 3 branches of 3 squares. In total, that's 10 squares."
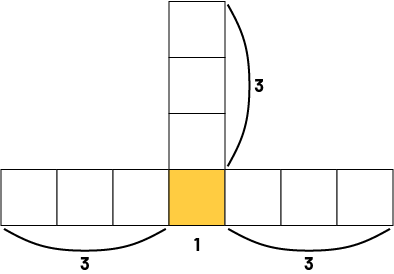
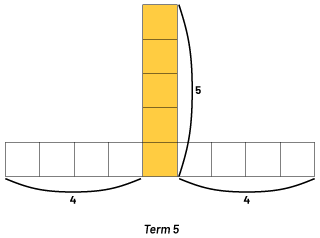
Student 3: "My strategy is different, but I got the same answer. I see a column of 4 squares, then 3 squares on the left and 3 squares on the right. In total, I counted 4 + 3 + 3, which is 10 squares."
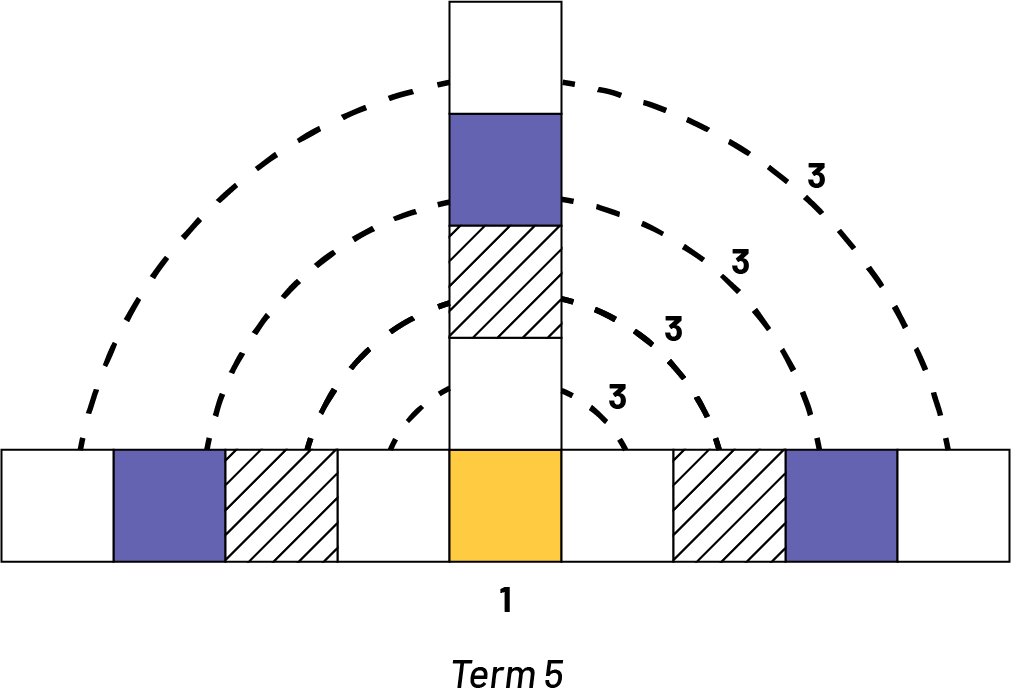
Student 4: "I see the squares in a different way. If I look at the pattern, it starts with a square and in each term, a square is added in three places. In the fourth term, the three squares have been added three times. In all, we have 10 squares."
- Does your strategy work for counting the number of squares in term 5?
Student 1: "Yes. I see that there are four squares on the left, four squares on the right, four squares at the top, and one square in the middle, at the bottom. That's 4 + 4 + 4 + 1, or 13 squares."
Student 2: "Yes. I see a square in the middle at the bottom and three branches of four squares. That's a total of 13 squares."
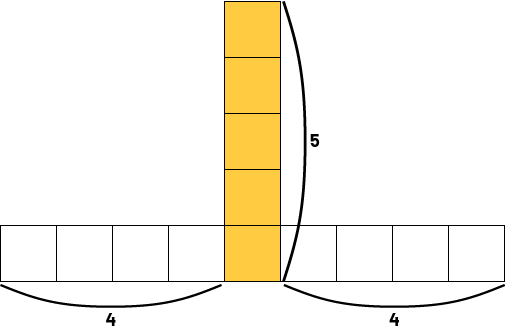
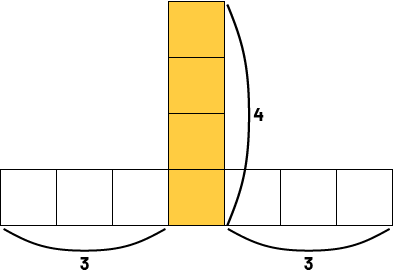
Student 3: "Yes. I see a column of five squares, then four squares on the left and four squares on the right. In total, I count 5 + 4 + 4, which is 13 squares."
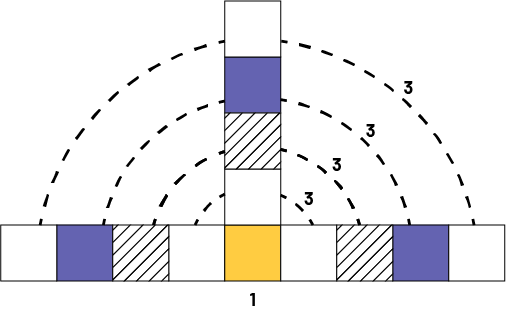
Student 4: "Yes. If I look at the pattern, it starts with a square, and in each term a square is added in three places. In term 5, we add the three squares four times. In all, we have 13 squares."
- How can you determine the number of squares for any term number?
Student 1: "To determine the number of squares for any term, I add a number three times, then add one."
- What is this number? How can you identify or name it?
Student 1: "It is always the previous term number."
- How can you express your pattern rule for determining the number of squares for any term more accurately?
Student 1: "To determine the number of squares for any term number, I add the term number of the previous term 3 times, then add 1."
Student 2: "To determine the value of any term, I multiply by 3 and add 1."
- How can you now express this pattern rule (functional relationship) with an equation?
Student 1: "The
equation would be s =(n - 1) +(n - 1) +(n - 1) + 1, where n is the term number and s is the number of squares in it."
Student 2: "To determine the value of any term, I multiply by 3 and add 1."
- What do you multiply by three?
Student 2: "I multipled the previous term number by 3."
- If we represent the term number by n, how can we represent the previous term number?
Student 2: "This is n - 1. So the equation is \(s = 1 + 3 \times (n - 1)\), where n is the term number and s is the number of squares in that term."
Student 3: "Each term has three branches. One branch has the same number of squares as the term number and the two others branches have one less square than the term number. To determine the total number of squares, I add these three numbers together."
- Can you explain your pattern rule in another way?
Student 3: "To determine the number of squares that make up any term, I add 3 values, the term number and twice the previous term number. So, s = n + (n - 1) + (n - 1), where n is the term number and s is the number of squares in it."
Student 4: "I do 3 times a number to determine the number of squares on the 3 branches and add 1 for the one in the center. Basically, I multiply the previous term number by 3 and add 1. So \(s = (n - 1) \times 3 + 1\), where n is the term number and s is the number of squares in it."
Teachers then prompt students to check the validity of their pattern rule. To validate the rules, a table of values is used.
- According to your rule, if n takes a value of 4, what is the corresponding value of s?
Student 1: "My equation becomes \(s = (4 - 1) + (4 - 1) + (4 - 1) + 1\). Therefore, \(s = 10\)."
Student 2: "My equation becomes \(s = 1 + 3 \times (4 - 1)\). Therefore,\(s = 10\)."
Student 3: "My equation becomes \(s = 4 + (4 - 1) + (4 - 1)\). Therefore, \(s = 10\)."
Student 4: "My equation becomes \(s = (4 - 1) \times 3 + 1\). Therefore, \(s = 10\)."
- What does this value of s correspond to in your equation?
Student 1: "The variable s represents the number of squares that make up the term. In the given pattern, it is true that the 4th term is composed of 10 squares."
- According to your equation, s = 10 when n = 4. What does this correspond to in the table of values?
Student 2: "According to the table of values, the 4th term is composed of 10 squares. This matches what I get from the equation."
In the previous example students extended the pattern, analyzed the pattern to describe a rule, and created a table
of values showing the term values for each term number, and were asked to make connections between each of the
representations.
Source: translated from Guide d’enseignement efficace des mathématiques de la 4e à la 6e année, Modélisation et algèbre, p. 54-64.
Skill: Using Symbolic Representations of Rules to Find Unknown Values in Linear Growing Patterns
When a rule for a linear growing pattern is expressed as an equation, the variables in the equation represent the term number and the term value. When a specific term numer is substituted into the equation, the equation can then be solved for the corresponding term value. When a specific term value is substituted into the equation, the equation can then be solved for the corresponding term number.
Source: translated from Guide d’enseignement efficace des mathématiques, de la 7e à la 10e année, Fascicule 2, Algèbre, p. 12.
Example of a Representing the Relationship Between Two Variables and Solving for an Unknown
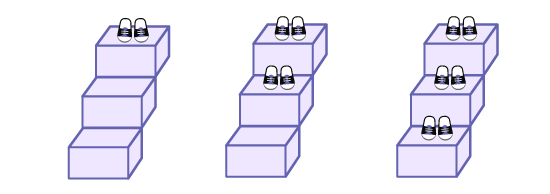
Write the equation s = g × 2 on the board and present its context:
Eric invites some friends to his house. When they enter, he asks them to take off their shoes and put them on a step of the stairs. We are interested in the relationship between the number of guests (g) and the number of shoes (s).
With students, create a geometric pattern, and a table of values to represent the relationship between number of
guests and the number of shoes. Ask students to create a graph. The following questions can be asked to give
contexts to solving for unknown values.
| Number of Guests (g) | 1 | 2 | 3 | … |
|---|---|---|---|---|
| Number of Shoes (s) | 2 | 4 | 6 | … |
Ask students to explain what variable g (the number of guests), variable s (the number of shoes), and "× 2" (the number of shoes per person) represent.
Relevant questions
- How can you determine the total number of shoes using the table of values? the graph? the equation?
- Use the equation to determine how many shoes will be on the stairs if Eric has 6 guests? 15 guests? Verify the reasonableness of your answer using the table of values and the graph.
- Use the equation to determine how many guests will Eric have if there are 48 shoes on the steps. Verify the reasonableness of your answer using the table of values and the graph.
Source: translated from Guide d’enseignement efficace des mathématiques de la 4e à la 6e année, Modélisation et algèbre, p. 238.
Knowledge: Interpolation
Interpolation is the process of estimating values that lie within a given range.
Source: Ontario Curriculum, Mathematics Curriculum, Grades 1-8, 2020, Ontario Ministry of Education.
Example
Determine the value of the cost when the quantity is 7.
| Quantity | 2 | 4 | 6 | 8 | 10 | 12 |
|---|---|---|---|---|---|---|
| Cost ($) | 6 | 12 | 18 | 24 | 30 | 36 |
Note: In this case, the student can average the costs of quantities 6 and 8.
Knowledge: Extrapolation
Extrapolation is the process of estimating values that lie outside of a given range.
Source: Ontario Curriculum, Mathematics Curriculum, Grades 1-8, 2020, Ontario Ministry of Education.
Example
Determine the value of the cost when the quantity is 22.
| Quantity | 2 | 4 | 6 | 8 | 10 | 12 |
|---|---|---|---|---|---|---|
| Cost ($) | 6 | 12 | 18 | 24 | 30 | 36 |
Note 1: In this case, the student can first determine that the equation is c =3q, and then calculate the cost by replacing q with 22, which results in $66.
Note 2: Vary between the term number and the term value as the unknown value. This will encourage flexibility and deepen understanding.