General Foundations of Data
Intermediate Division
Introduction
The application of the concepts of data and probability is very common in our daily lives, as newspapers, magazines, radio, television, and the Internet often use graphs and statistical data to communicate information or convey a message; for example, advertisements, sports scores, opinion polls, demographic trends, health risk assessments, and weather forecasts.
According to Burns (2000), an appropriate knowledge of the concepts of data and probability is an asset in students' lives. They can thus:
- prepare to live in an increasingly statistically driven society;
- avoid being misled by statistics;
- develop their reasoning skills;
- reduce their uncertainty;
- faithfully report the reality;
- dispel certain prejudices;
- properly formulate their arguments;
- justify their results with quantitative data.
In the Mathematics Curriculum, data management and probability are in a single strand. These two topics are closely connected, because both involve collecting, organizing, analyzing and drawing conclusions with a degree of certainty. While it is possible to manage data without using probability, the opposite is not always the case, since data is essential to the calculation of probability. Teachers should therefore use an integrated approach to teaching the concepts of data and probability; for example, they may ask students to:
- represent data collected from a survey or probability experiment in a table or graph and analyze it;
- communicate their interpretation of the tables or graphs using appropriate terminology;
- use primary or secondary data to answer a question of interest, formulate a conclusion, or determine the probability of an event;
- make critical judgments about how data was collected, its representation in a graph, and the conclusions drawn.
Data management and probability are usually part of the branch of mathematics called statistics. In statistics, one of the main goals of teaching is to help students analyze quantifiable data and make decisions in situations involving variability.
image Title: Data strand Major Component: Managing and interpretating quantitative data Two related sub-elements: 'Statistics in mathematics' and 'Statistics applied to other subjects'Under 'Statistics in Mathematics', Data Literacy;Inquiries,Data measurement,Range, Mode, Median,Mean Probability : Theoretical probabilities, Experimental probabilitiesUnder “Statistics applied to other subjects”; Social Sciences and Humanities, Business Studies, Health and Physical Education, Psychology, Sociology, Mechanics, Physics, Biology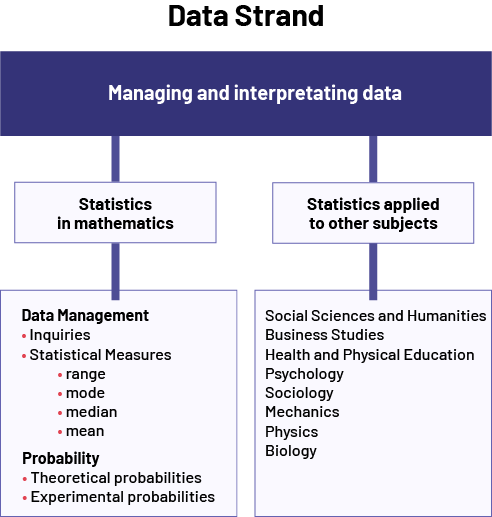
Effective Teaching of Data Management and Probability
The goal of teaching the Data strand in the intermediate grades is to increase students' data literacy and develop their probabilistic thinking. To achieve this goal, teachers should present students with authentic learning situations that use the inquiry process and foster the development of essential skills, illustrated below:
image First box: Data Arrow pointing to another box with two headings connected by a straight line with an arrow at each end: Inquiry and Skills Under 'Inquiry',Formulating a question Collecting data Analyze the data and interpret the results Under 'Skills',Reasoning Visualizing Problem Solving Communicating Arrow from this box to another box with the following titles: Data Literacy Probabilistic Thinking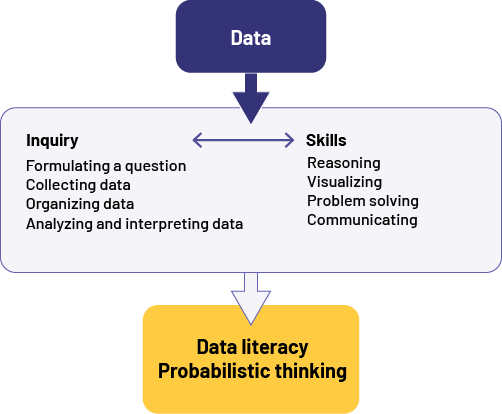
Source: translated from Guide d’enseignement efficace des mathématiques, de la 4e à la 6e année, Traitement des données et probabilité, p. 5-7.
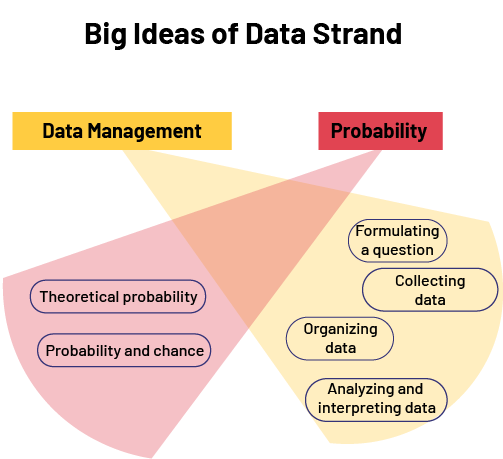
Big Ideas in the Data strand
image The schema is titled 'Big Ideas of Data strand'. The phrase 'Data Processing' is highlighted in orange. Next to it, the word 'Probability' is highlighted in red. From each of these, a beam of light of the same color unfolds. In the orange beam, the following four phrases are circled: 'Formulating a question. Collecting data.Organizing data. Analyzing and interpreting data.' In the red beam, the following two phrases are circled: 'Theoretical probability. Probability and chance.'
Overview
In mathematics, data management and probability are in a single strand because their concepts are related and use the same skills; for example, the statistical standards that guide sample selection in a survey are based on probability, just as theoretical probability models are validated by the probability experiments that involve data collection and management.
To help teachers define and prioritize the key concepts in this strand, as well as to implement effective teaching strategies, two big ideas are proposed. These big ideas refer directly to the two main concepts that make up the strand being addressed, namely data management and probability.
Big Idea 1: Data Management
Engaging with data management helps develop data literacy skills.
Key Point 1 - Identifying the Situation
Identifying a situation allows for the formulation of relevant questions of interest that can be answered through data collection and analysis.
Key Point 2 - Collecting Data
Planning and conducting data collection provides meaningful data.
Key Point 3 - Organizing and Representing Data
Organizing and representing data in tables and graphs helps communicate information for the purpose of interpreting that data.
Key Point 4 - Analyzing and Interpreting Results
Interpreting the results helps to draw relevant conclusions to answer questions of interest in order to make informed decisions.
Big Idea 2: Probability
Probabilistic thinking helps to make decisions by taking into account the uncertainty arising from chance.
Key Point 1 - Probability and Chance
Understanding probability helps us to understand possible outcomes for situations that involve chance.
Key Point 2 - Theoretical and Experimental Probability
The analysis of data collected during randomized experiments allows us to better understand the concept of theoretical probability.
Source: translated from Guide d’enseignement efficace des mathématiques, de la 4e à la 6e année, Traitement des données et probabilité, p. 23-24.
The inquiry process is a problem-solving process that focuses on the collection and analysis of data. Data is at the heart of all thinking related to data literacy and probabilistic thinking. Students will therefore have the opportunity to develop their data literacy and probabilistic thinking skills as they are exposed to a variety of situations that involve the inquiry process.
The organized list below summarizes the four steps in this process. These steps are further described in key points of the Big Idea: Data Management.
Steps in the Inquiry Process
- Identify the situation
- Clarify the problem.
- Formulate one or more questions that can be answered based on data.
- Collect data
- Develop a plan to collect relevant and appropriate data.
- Perform data collection according to the plan and record it.
- Organize the data
- Consolidate the data collected.
- Represent data appropriately.
- Analyze the data and interpret the results
- Compare and combine data.
- Make sense of the data.
It is important to note that these steps are very similar to those of the problem-solving process. The term 'steps' is not meant to imply that the process is linear and sequential. In fact, we go back and forth between the steps as needed; for example, when interpreting the results (step 4) of a survey presented in a graph, one might consider that a different representation of those results might provide new information. One might then go back to the data organization step (step 3) and create the new representation. One might even go back to the question of interest (step 1) if one realizes that it was inaccurate or incomplete, or that the results do not match the original intent.
Source: translated from Guide d’enseignement efficace des mathématiques, de la 4e à la 6e année, Traitement des données et probabilité, p. 11-12.
Reasoning, visualizing, problem solving, and communicating are skills that are closely related to the development of data literacy and probabilistic thinking. With these skills, students can not only effectively collect and organize data or describe probabilities, but also understand and use them appropriately, both as creators and consumers of data. Therefore, teachers should continually look for opportunities to encourage students to develop and use these skills.
Reasoning Skills
Reasoning skills help students organize their thinking.
In data management, reasoning skills play a prominent role at all steps of the inquiry process. Teachers can help students develop these skills through their choice of questions. For example, when students are trying to identify a given situation (step 1), they can encourage them to clarify the situation and think about formulating an appropriate question of interest. Or, when interpreting the results, they can encourage them to make connections between the data and read beyond them.
Reasoning skills are also widely applied in situations involving probability. In fact, to make informed decisions in any situation where the results vary randomly, it is important to appeal to reason rather than intuition. This is one of the foundations of probabilistic thought. For example, if we roll an even number three times in a row, our intuition might lead us to believe that the next roll will almost certainly result in an odd number. However, by appealing to reason, we find that the probability of obtaining an even number during the fourth roll is equal to the probability of obtaining an odd number. Such intuitive misunderstandings are very common in probability, and in some adults they are very entrenched. Teachers should therefore use a variety of situations to help students base their assessment of the likelihood of an event or outcome on reason rather than intuition.
Visualizing Skills
Visualizing is the ability to form a mental image of a situation or an abstract concept and involves:
- organizing a lot of information into a mental image;
- using a network of mental images to solve problems;
- understanding mathematical concepts and processes by using visual representations.
To develop these skills with learning in the Data strand, students should have multiple opportunities to see, create, and use different representations of the same data.
Visualization is very useful during the inquiry process; for example, to get a clear picture of a given situation (step 1), students can first organize their ideas using a concept map. The mental image they create of this map then allows them to remember a summary of the situation that will be used in all steps of the inquiry process. They can also create a graph, such as a bar graph or a broken-line graph, to represent data. This will allow them to better visualize the distribution of the data.
image The concept map begins with the phrase 'The Tsunami' placed in a red square. Three branches connect it to three sets of elements. First, it is connected to a bubble that says, 'How can it be prevented?'. This one links to the following elements: 'Alarm system. Listening to animals. Education.' The second branch links to a bubble in which it says, 'What's that?' This one links to the following elements: 'Training. Wave. Warning signs.' Finally, its third branch links to an isolated bubble, in which it says, 'Consequences'.
Visualizing skills can support understanding of abstract concepts, for example, the equal share model can promote a deeper understanding of what an average is, and a probability line is an effective visual way to compare the probability of two events.
image The probability line has a bar starting from white and gradually turning red. Above the bar it says 'Probable', with two arrows pointing to the extremes of the bar. At the far left of the bar, it is written impossible. In the center of the bar, it is written equiprobable. Between the left and the center, it is written unlikely. At the extreme right, it is written certain. Between equiprobable and certain, it is written very probable. On the left side of the bar, there is the letter 'B'. On the right side of the bar, there is the letter 'A' on the left, and the letter 'C' on the right. Below the bar it is written, 'Event B is less likely to happen than event A, and event C is more likely to happen than event A.'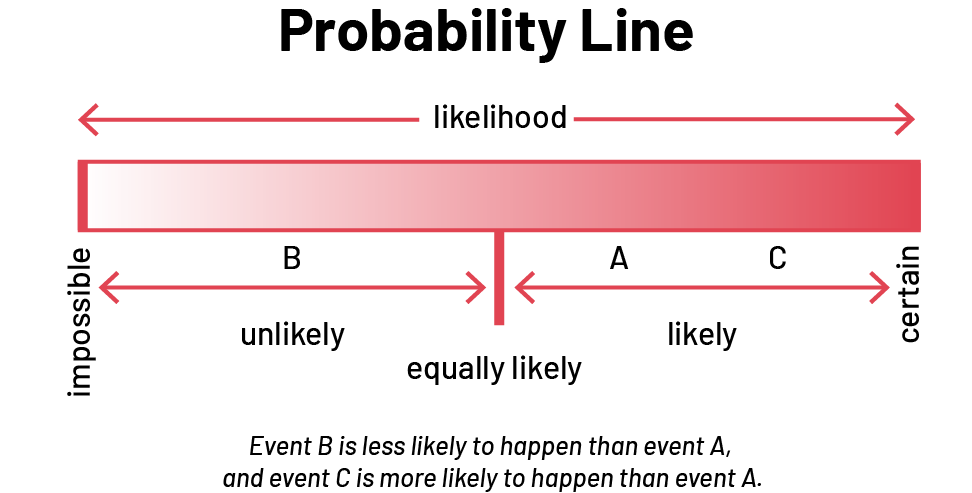
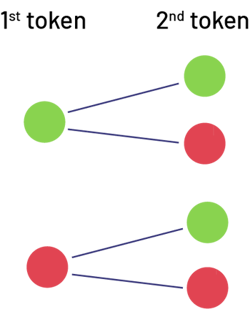
Similarly, the tree diagram is an effective way to visualize all possible outcomes of an experiment.
Example
Problem-Solving Skills
Learning in the Data strand is best facilitated through engaging problem-solving situations that involve students in the inquiry process. The chart below illustrates how the steps to problem solving and the inquiry process are connected.
| Steps to Problem Solving | Steps in the Inquiry Process |
|---|---|
| Understand the problem |
Identify the situation
|
| Develop a plan |
Collect data
|
| Implement the plan |
Organize the data
|
| Check the results |
Analyze the data and interpret the results
|
As in other areas of mathematics, the learning of Data strand concepts must be done in a problem-solving situation. Teachers should therefore present students with engaging situations that encourage them to use the inquiry process. It is important to emphasize the increased importance of context in the Data strand. It is virtually impossible to solve a problem without considering context; for example, the raw data obtained from a third-party investigation is meaningless if nothing is known about the investigation itself. Similarly, it is impossible to interpret a bar graph or a broken-line graph if one does not know what the data is referring to because the axes on the graph in question do not have labels.
Communication Skills
Communication skills, in the Data strand as well as in all other strands of mathematics, are an essential means of learning. Among other things, they help students express their understanding and clarify their thinking. Radford and Demers (2004) point out that communication in all its aspects is a means of transforming knowledge, and that learning is about appropriating that knowledge.
Teachers should foster a climate of engagement during conversations within the class by presenting large-scale learning situations that require students to interact with each other in order to understand the problem and find a solution. Communication, whether oral or written, must use appropriate symbols, terminology, and graphical representations, as well as mathematical reasoning and arguments that emphasize the concepts involved.
Oral Communication
Students need to learn how to use oral communication to achieve a variety of objectives. By asking students questions, teachers can generate discussions that focus on a particular objective. The table below provides some examples.
| Objective | Questioning |
|---|---|
| Relate relevant past experiences |
What did you observe in the graphs? How were they created? Would you have the same results if you repeated this experiment 10 more times? |
| Formulate and explain a prediction |
Do you think there will be more students in the 200 m event than in the obstacle course? Justify your answer. Do you think it is more likely that the arrow will stop in the red sector of the spinner than in the blue sector? Why or why not? |
| Compare different strategies or ideas |
From the list of questions, choose one to conduct your survey. Justify your choice. To perform this probability experiment, is it more appropriate to use a spinner or a die? |
| Share a task | What is the role of each member of your team? |
| Discuss relationships, similarities, or differences |
What are the similarities and differences between these two tables? What is the relationship between the frequency of this outcome and the frequency of each of the other two outcomes? |
| Justify |
Why did you choose this key? Why do you say there are probably more blue marbles than red marbles or yellow marbles in the bag? |
| Explain |
What process did you follow to collect and record your data? What modifications should be made to this graph? |
Written Communication
Writing down ideas is usually more difficult than expressing them orally. However, there are situations where the opposite is true; for example, students can represent a set of statistical data much more succinctly and effectively with a circle graph than with an oral description. However, they need to learn to correctly use the various common data representations to ensure that the message being conveyed is the right one and that it is clearly understood by others. They can then use these representations to justify their reasoning or to support an argument in a math conversation in the classroom.
In the Data strand, students have multiple opportunities to use written communication. They can, for example:
- organize ideas using a concept map;
- formulate a question of interest;
- formulate survey questions;
- record a prediction, observation, or reflection;
- compile data in a table;
- present a set of data in a graph;
- express a conclusion or decision;
- describe the probability of an event.
Source: translated from Guide d’enseignement efficace des mathématiques, de la 4e à la 6e année, Traitement des données et probabilité, p. 12-19.
Students need direction and guidance in learning to solve problems related to data and probability. Teachers need to have a broad view of the learning pathway that students follow and plan learning activities accordingly. They need to identify situations where it is important to use direct instruction by making sure to model their approach, questioning, and reasoning. Teachers should also:
- provide students with a variety of engaging learning situations at an appropriate level of difficulty;
- encourage students to use concrete and pictorial representations;
- ensure that students use data management and probability terminology appropriately;
- focus on conceptual understanding;
- asks questions that help students reach a certain stage or that encourage them to reflect and clarify their thinking.
Effective instruction in the Data strand also involves the simultaneous development of students' probabilistic thinking and data literacy skills. It is important, therefore, to help students make connections between data management and probability concepts. To do this, teachers should choose learning situations that will help students make these connections; for example, the teacher asks them to determine the likelihood of an event using data from a survey (Example 1) or to follow some of the steps in the inquiry process using data from a probability experiment (Example 2).
Example 1
The teacher presents the data related to smoking specifically concerning the members of a track and field team, aged 15 years. The students create a circle graph to represent this data. The teacher asks the students to use this graph to determine the probability that a member of this team smokes today. (If we compare the percentages 68% and 6%, which correspond respectively to 'never' and 'less than once a week', and the percentages 21% and 5%, corresponding respectively to 'every day' and to 'at least once a week', we find that the probability that a member smokes today is 26% and that a member does not smoke is 74%. We can therefore predict that, if we meet a member of this team today, the probability that they smoke is approximately \(\frac{1}{4}\) and that they do not smoke is \(\frac{3}{4}\).)
image The pie chart is titled 'Track and Field Team Members' and is divided into four slices. The largest slice, which corresponds to Never, takes up 68 percent of the circle. The other three slices are detached from the largest. 'Every day' corresponds to 21 percent of the circle, 'At least once a week, but not every day' corresponds to five percent of the circle, and 'Less than once a week' corresponds to six percent of the circle.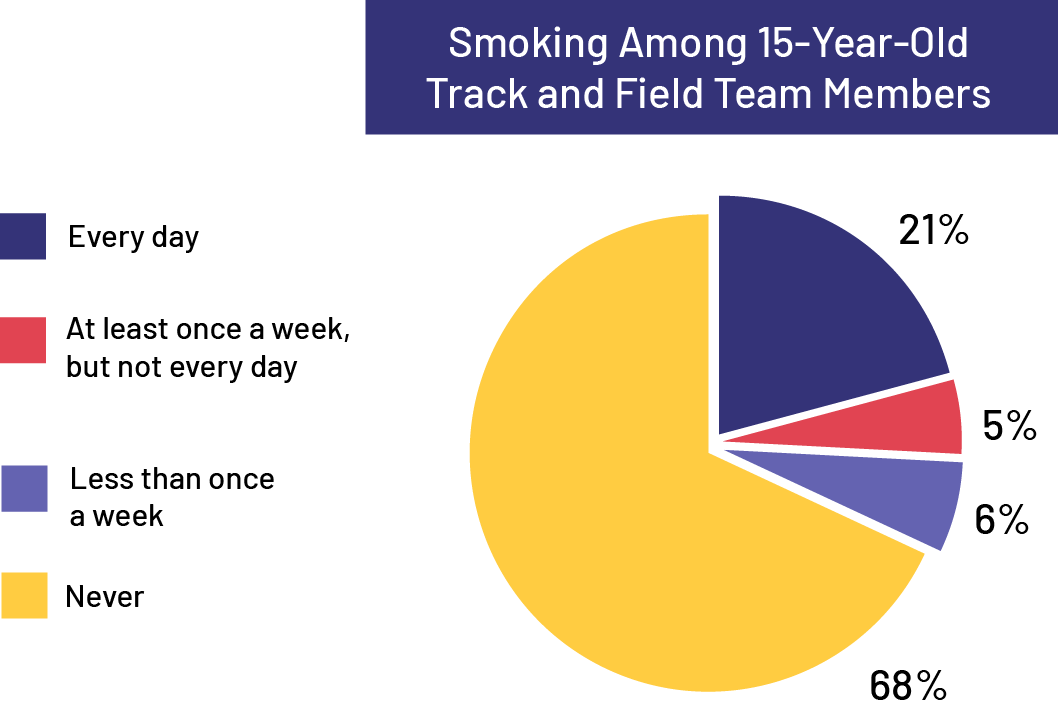
Example 2
The teacher gives each pair of students a bag of 50 tokens, some of which are red and some of which are blue. The teacher suggests that they conduct a probability experiment to determine the likely distribution of colours. Each pair of students must draw a token from the bag 100 times, record its colour, and return the token to the bag. To compile the data, students must use a relative frequency table.
Source: translated from Guide d’enseignement efficace des mathématiques, de la 4e à la 6e année, Traitement des données et probabilité, p. 20-21.
Math Conversations
A math conversation is a time of objectification, during or after learning, which goes beyond the simple exchange of ideas and strategies used by the students. During the conversation, students seek to defend their ideas and convince others of the merits of their strategies and solutions.
A math conversation is a powerful pedagogical moment in which teachers strategically lead conversations to bring out important mathematical ideas, and it lends itself well to a pedagogical approach based on the vision that students are a learning community.
Points to Consider
- To facilitate discussions during the math conversation, organize a meeting area where students can exchange ideas and make presentations, reinforcing their sense of community. The meeting area should :
- be spacious and well defined so that students can gather there to exchange ideas, discuss, and make presentations;
- be large enough for each student to move a little without disturbing the others;
- be away from storage shelves, which could be a distraction during the meeting;
- be near anchor charts to refer to them, if necessary;
- be near the presentation tools.
- During the exploration, the teacher circulates among the students, observes the teams' process and listens to their discussions. These observations allow the teacher to choose the order of presentations for the conversation. This choice is guided by the teacher's goal, such as the application of a strategy and the use of a mathematical model, to ensure understanding of the concepts.
- It is not necessary to present each student's work; it is best to limit the presentation to approaches or solutions that stand out. Ask students to show their solution or approach if it is similar to the one presented, but do not explain it. Be sure to choose different students from one conversation to another.
- During the conversation, invite each team member to present his or her reflection on the work accomplished after preparing clear and convincing arguments.
- During the conversation, invite students to ask questions about the presenter's approach and explanations. This questioning encourages students to check their own understanding and helps presenters adjust their understanding as well.
- Create an atmosphere of trust and respect in the classroom where all students are encouraged to participate in activities and where all input is valued; for example, a student should feel comfortable presenting an error in his or her work as a counter-example that will help everyone's understanding.
- Ask students strategic questions to help them build a clear understanding of the concepts. Some examples include:
- Can anyone summarize the idea presented?
- How did you go about...?
- How did you overcome this difficulty?
- Why did you use this strategy?
Source: translated from Guide d’enseignement efficace des mathématiques, de la maternelle à la 3e année, Traitement des données et probabilité, p. 283-284.