General Foundations of Data
Primary Division
Introduction
The application of the concepts of data and probability is very common in our daily lives, as newspapers, magazines, radio, television, and the Internet often use graphs and statistical data to communicate information or convey a message; for example, advertisements, sports scores, opinion polls, demographic trends, health risk assessments, and weather forecasts.
According to Burns (2000), an appropriate knowledge of the concepts of data and probability is an asset in students' lives because it supports them to:
- live in an increasingly statistically driven society;
- avoid being misled by statistics;
- develop their reasoning skills;
- reduce their uncertainty;
- make accurate representations of data;
- dispel certain prejudices;
- properly formulate their arguments;
- justify their results with quantitative data.
In the Mathematics Curriculum, data management and probability form a single strand. These two topics are closely connected because both involve collecting, organizing, analyzing and drawing conclusions with a degree of certainty. While it is possible to manage data without using probability, the opposite is not always the case, since data is essential to the calculation of probability. Teachers should therefore use an integrated approach to teaching the concepts of data and probability; for example, they may ask students to:
- classify objects according to various attributes;
- classify certain events according to the attributes of frequency, certainty, or probability;
- represent data collected in a survey or probability experiment in a table or graph and analyze it;
- use data to answer a question of interest and communicate a conclusion or decision using appropriate terminology;
- make critical judgments about how data was collected, its representation in a graph, and the conclusions drawn.
Data management and probability are usually part of the branch of mathematics called statistics. Statistical measures are used to analyze qualitative and quantifiable data and to make decisions in situations that involve variablility.
image Title: Data strand Major Component: Managing and interpretating quantitative data Two related sub-elements: 'Statistics in mathematics' and 'Statistics applied to other subjects'Under 'Statistics in Mathematics', Data Literacy;Inquiries,Data measurement,Range, Mode, Median,Mean Probability : Theoretical probabilities, Experimental probabilitiesUnder “Statistics applied to other subjects”; Social Sciences and Humanities, Business Studies, Health and Physical Education, Psychology, Sociology, Mechanics, Physics, Biology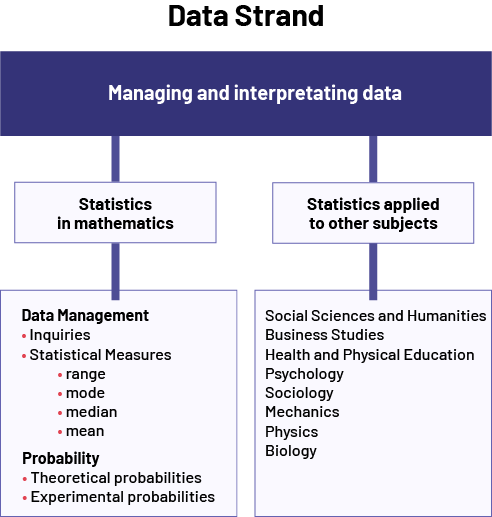
Effective Teaching of Data Management and Probability
In the Primary Division, the goal of the learning in the Data strand is to increase students' data literacy and develop their probabilistic thinking. To achieve this goal, teachers will need to present authentic learning opportunities that engage the inquiry process and foster the development of skills that support data literacy and probabilistic thinking, as illustrated below:
image First box: Data Arrow pointing to another box with two headings connected by a straight line with an arrow at each end: Inquiry and Skills Under "Inquiry",Formulating a question Collecting data Analyze the data and interpret the results Under "Skills",Reasoning Visualizing Problem Solving Communicating Arrow from this box to another box with the following titles: Data Literacy Probabilistic Thinking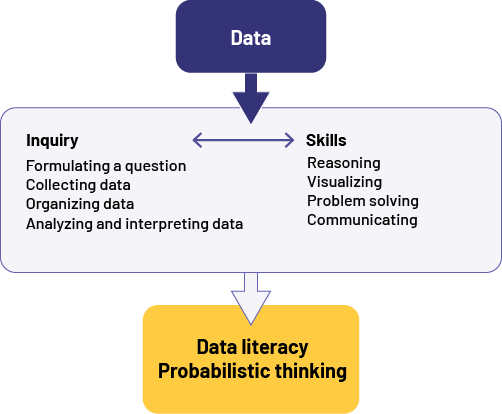
In what follows, each element is explained in more detail, and the role of teachers in the context of effective data management and probability instruction is presented.
Source: translated from Guide d’enseignement efficace des mathématiques, de la maternelle à la 3e année, Traitement des données et probabilité, p. 7-10.
Big Idea: Data Literacy and Probabilistic Thinking
Background
The overall and specific expectations of the Data strand involve many concepts. Grouping them under the big idea of data literacy and probabilistic thinking supports teachers to plan more effective instructional programming that anchors students learning in important takeaways related to learning about data and probability. This big idea includes the ability to critically analyze statistical data and the ability to determine the likelihood of an event or outcome.
Big Idea: Data Literacy and Probabilistic Thinking
Activities that use data management and probability build skills in statistical literacy and develop probabilistic thinking.
Key Point 1:
Sorting and classfying data is important in helping us to understand it.
Key Point 2:
Planning and conducting a survey helps us to the collect and record meaningful data.
Key Point 3:
Representing data in tables and graphs helps us communicate and interpret data.
Key Point 4:
Data analysis helps us to interpret results and draw relevant conclusions in order to make informed decisions.
In the Primary and Junior Divisions, students enjoy learning about their environment. They are curious and ask all sorts of questions about their peers, such as what they like, how old they are, how tall they are, how many siblings they have, and where they were born. Teachers can take advantage of this natural curiosity and encourage them to follow the inquiry process to get answers to their questions. In this way, starting with simple situations, students acquire basic data literacy skills as they gradually learn to formulate questions of interest, and then to collect, organize, represent, and analyze data.
Students also develop probabilistic thinking as they learn to use certain words or phrases to describe the frequency or likelihood of an event or outcome. In addition, as they follow the inquiry process in a probability experiment, they develop a basic understanding of the concept of variability.
Source: translated from Guide d’enseignement efficace des mathématiques, de la maternelle à la 3e année, Traitement des données et probabilité, p. 34-35.
The inquiry process is a problem-solving process that focuses on the collection and analysis of data. Data is at the heart of data literacy and probabilistic thinking. Students will therefore have the opportunity to develop their data literacy and probabilistic thinking skills as they are exposed to a variety of situations that involve the inquiry process.
The organized list below summarizes the four steps of the inquiry process. These steps are further described in key points 2, 3, and 4 of the Big Idea: Data Literacy and Probabilistic Thinking.
Steps in the Inquiry Process
- Identify the situation
- Clarify the problem.
- Formulate one or more questions that can be answered based on data.
- Collect data
- Develop a plan to collect relevant and appropriate data.
- Perform data collection according to the plan and record it.
- Organize the data
- Consolidate the data collected.
- Represent data appropriately.
- Analyze the data and interpret the results
- Compare and combine data to tell a story.
- Make sense of the data.
Steps in the Inquiry Process
It is important to note that these steps are very similar to the problem-solving steps. The term "steps" is not meant to imply that the process is linear and sequential. In fact, we go back and forth between the steps as needed; for example, when interpreting the results (step 4) of an inquiry presented in a graph, one might consider that a different representation of those results might provide new information. One might then go back to the data organization step (step 3) and create the new representation.
One might even go back to the question of interest (step 1) if one realizes that it was inaccurate or incomplete, or that the results do not match the original intent.
Source: translated from Guide d’enseignement efficace des mathématiques, de la maternelle à la 3e année, Traitement des données et probabilité, p. 17-18.
Reasoning, visualizing, problem solving, and communicating are skills that are closely related to the development of data literacy and probabilistic thinking. With these skills, students can not only effectively collect and organize data or describe probabilities, but also understand and use them appropriately, both as creators and consumers of data. Therefore, teachers should continually look for opportunities to encourage students to develop and use these skills.
Reasoning Skills
Reasoning skills help students organize their thinking.
In data management, reasoning skills play an important role in all steps of the statistical problem-solving process.
Example
The teacher has circled the birthdates of the students in the class on a calendar. A student wonders in which season the majority of the students were born and decides to conduct a survey using the existing data. The student groups the data by season and decides to represent it in a pictograph. Before creating the graph, the student had to consider the choice of picture (a cake) and the most appropriate scale (two-to-one correspondence).
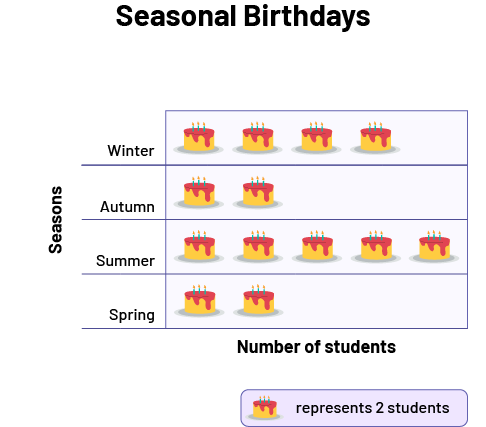 image Horizontal pictogram chart with the title Seasonal birthdays, the title of the vertical axis, Seasons, and the title of the horizontal axis, Number of Students. It is composed of four categories: Winter, with four cakes, Automn, with two cakes, Summer, with five cakes, and Spring, with two cakes. Legend: one cake represents two students.
In probability, reasoning skills are also used extensively. In any situation involving chance, outcomes cannot be predicted with certainty, so you have to consider the outcome that has the best chance of occurring. Since it is not always easy to determine this outcome, it is tempting to rely on intuition.
In the Primary Division, teachers need to help students remain objective and to use their reasoning skills by presenting them with simple chance situations and then asking them to predict the outcome and explain why they made the prediction. By justifying their prediction, they will develop their reasoning skills.
Example
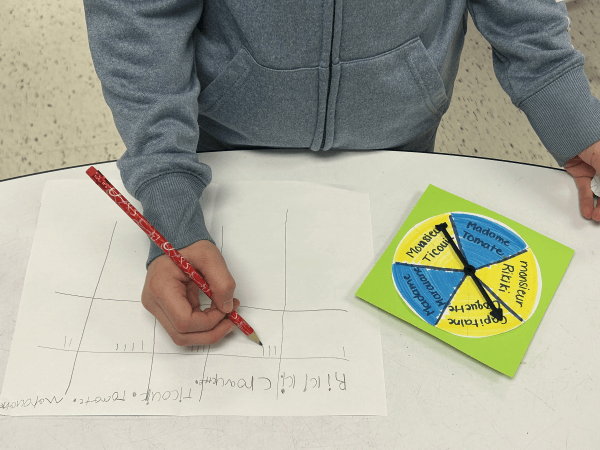
The teacher instructs the students to spin the arrow on the spinner twice and record the results. The teacher then asks them to predict the sector in which the arrow will stop on a third try and justify their prediction.
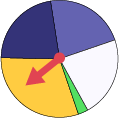
Most students intuitively recognize that it is more likely that the arrrow will stop in the yellow sector than in any other sector, without necessarily being able to explain the reason correctly. They will need to perform many probability experiments with different spinners to fully understand that, in this situation:
- it is more likely that the arrow stops in the yellow sector because it is the sector with the largest area;
- the results of the first two tries have no influence on the result of the third try.
Visualizing Skills
Visualizing is the ability to form a mental image of a situation or an abstract concept and involves:
- organizing a lot of information into a mental image;
- using a network of mental images to solve problems;
- understanding mathematical concepts and processes by using visual representations.
To develop these skills with learning in the Data strand, students should have multiple opportunities to see, create, and use different representations of the same data.
Example 1
The teacher constructs a concrete graph with the kindergarteners to represent all of the fruit found in their lunch bags; for example, 7 apples, 4 oranges, and 3 bananas. By forming a concrete representation of this graph, the students can better visualize the fact that there are more apples than oranges or bananas.
The teacher can then present them with a pictograph that represents the same data. Children will be able to better understand this new type of graph if they compare it with their mental representation of the concrete graph.
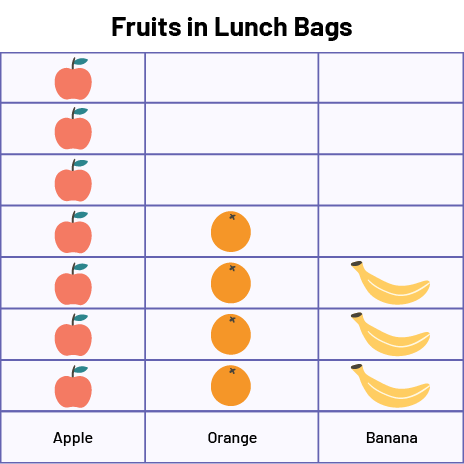
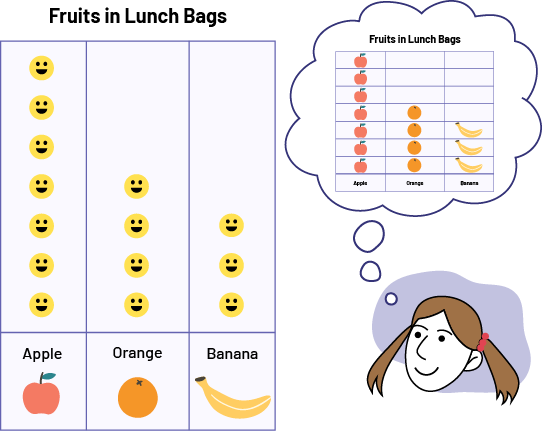 image Vertical pictogram chart, with the title Fruit in Lunch Bags, consisting of three categories: Apple, counting seven apples, Orange, counting four oranges, and Banana, counting three bananas. To the right of this diagram is a young girl's head thinking about this same diagram.
Example 2
Each day for a week, the teacher records the number of crackers in the students' lunch bags. The following week, the teacher presents the results to the students using the pictograph below. The key indicates that there is a four-to-one correspondence.
The skill to visualize supports students to interpret that the red rectangle represents two crackers and the small red square represents one.
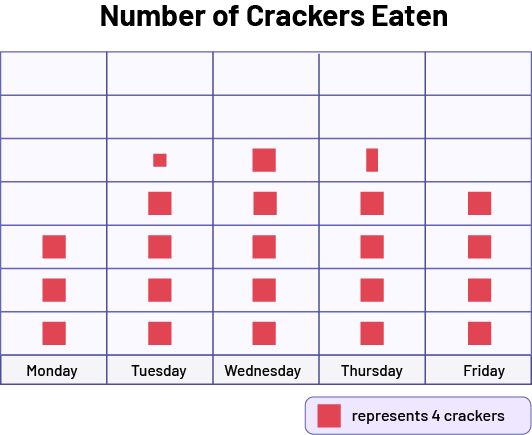 image Pictogram chart, with the title Number of crackers eaten, consisting of five categories: Monday, with three red squares; Tuesday, with four red squares and a quarter of red square; Wednesday, with five red squares; Thursday, with four red squares and half a red square; and Friday, with four red squares. Legend: One red square represents four crackers.
In probability, students can also use visualization to develop their understanding of abstract concepts.
Example
To test students' understanding of the random outcomes, the teacher asks the students which methods they might use in a probability experiment to generate random outcomes. The three most common responses are: spinning a spinner, pulling an object from a bag, and rolling a die.
The teacher then asks them to imagine how each of these tools could be created if they wanted to be certain of getting a certain outcome, for example, the letter h. Students could then visualize the tools in the following way.
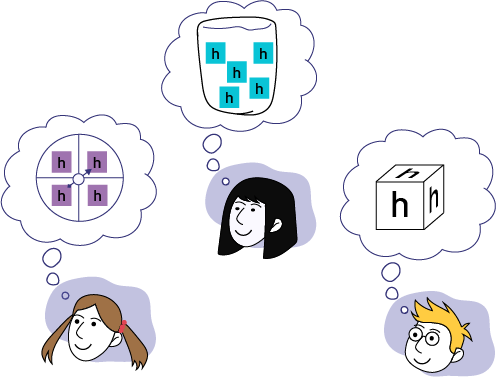 image Head of a young girl who thinks of a roulette wheel divided into four sectors, each containing the letter "h" in a purple square. Another girl's head thinks of a container with five "h's" in it, each letter in a blue square. Head of a boy who thinks of a cube with the letter "h" on one side.
The frequency, certainty, and probability line models described below are also excellent visual aids to understanding probability concepts conveyed by words such as sometimes, possible, and likely. Each of these words label an event or outcome on a continuum that runs from never to always or from impossible to certain. Placing an outcome on one of these lines provides a rough indication of whether that outcome is thought to be closer to one end of the continuum than the other.
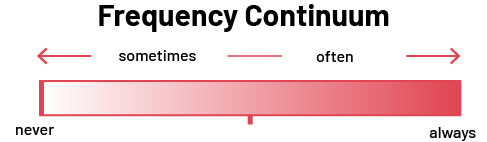
- The words never, sometimes, often , and always describe the frequency with which an event or outcome may occur.
- The frequency line represents a continuum, and its two ends (never and always) are fixed points that serve as anchors.
- The word sometimes describes the frequency of any event that can occur rarely or almost never.
- The word often describes the frequency of any event that can occur almost always.
- The location of an event on the frequency line indicates the assessment of how often an event or outcome may occur.

- The words impossible and certain describe the two ends of the continuum representing the possibility of an event or outcome occurring. These are fixed points that serve as anchors.
- An impossible event is an event that can never happen. A certain event is an event that will always happen.
Note: The converse of these two propositions are not necessarily true. Thus, in the context of an experiment, even if a result never occurred, it does not mean that it is impossible for it to occur. Similarly, the fact that one always obtains some result after a certain number of trials does not necessarily imply that one is certain to obtain it after all trials.
- The word possible describes all events or outcomes that are neither certain nor impossible.
- Where an event or outcome is located on the certainty line reflects one's assessment of the possibility of that event or outcome occurring.
- An event or outcome in the center of the certainty line is a possibility that may or may not occur.
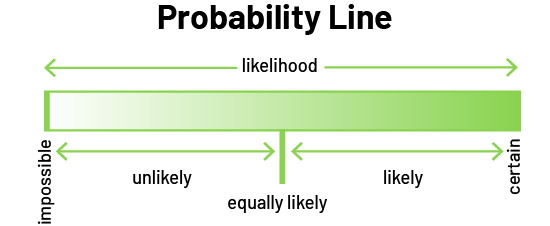 image Probability line in green. On the left, the word impossible, on the right, the word certain, above, in the center, the word probable, below, in the center, the phrase equally likely, in the center left, the word unlikely, and in the center right, the word likely.
- The words impossible and certain describe the two ends of the continuum representing the probability of an event or outcome occurring.
- The word likely refers to all events or outcomes that are neither certain nor impossible.
- The phrase equally likely qualifies an event or an outcome located in the center of the probability line and for which the probability that it occurs is equal to the probability that it does not occur.
- Unlikely describes a probability less than 50%, while very likely describes a probability of more than 50%.
Note: In the primary grades, students only intuitively assess the probability of an event or outcome occurring; only in the junior grades will they do so quantitatively using a fraction or percentage.
Problem-Solving Skills
Learning in the Data strand is best facilitated through engaging problem-solving situations that involve students in the inquiry process. The chart below illustrates how the steps to problem solving and the inquiry process are connected.
| Steps to Problem Solving | Steps in the Inquiry Process |
|---|---|
| Understand the problem |
Identify the situation
|
| Develop a plan |
Collect data
|
| Implement the plan |
Organize the data
|
| Check the results |
Analyze the data and interpret the results
|
Whether you are a consumer or producer of data, important contextual information such as a title, a legend, and labels are necessary in order to intrepret and bring meaning to it.
Communication Skills
Communication skills, in the Data strand as well as in all other strands of mathematics, help students to express their understanding and clarify their thinking. Radford and Demers (2004) point out that communication in all its aspects is a means of transforming knowledge, and that learning is about appropriating that knowledge.
Teachers must foster a climate of engagement during conversations within the class by presenting large-scale learning situations that require students to interact with each other in order to understand the problem and find a solution. Communication, whether oral or written, must use appropriate symbols, terminology, and graphical representations, as well as mathematical reasoning and arguments that emphasize the concepts involved. In the Primary and Junior Divisions, oral communication is a prerequisite to written communication.
Oral Communication
Students need to learn how to use oral communication to achieve a variety of goals. By asking students questions, teachers can generate discussions that focus on a particular goal. The table below provides some examples.
| Objective | Questioning |
|---|---|
| Relate relevant past experiences |
What did you observe in the graphs? How were they created? Would you have the same results if you repeated this experiment 10 more times? |
| Formulate and explain a prediction |
Do you think there will be more students in the 200 m event than in the obstacle course? Justify your answer. Do you think it is more likely that the arrow will stop in the red sector of the spinner than in the blue sector? Why or why not? |
| Compare different strategies or ideas |
From the list of questions, choose one to conduct your survey. Justify your choice. To perform this probability experiment, is it more appropriate to use a spinner or a die? |
| Share a task | What is the role of each member of your team? |
| Discuss relationships, similarities, or differences |
What are the similarities and differences between these two tables? What is the relationship between the frequency of this outcome and the frequency of each of the other two outcomes? |
| Justify |
Why did you choose this key? Why do you say there are probably more blue marbles than red marbles or yellow marbles in the bag? |
| Explain |
What process did you follow to collect and record your data? What modifications should be made to this graph? |
In the context of probability, the development of terminology is important to the development of probabilistic thinking. Initially, students tend to describe the probability of an event using common vocabulary; for example, "I eat spaghetti every Friday night. It's like this all the time." or "I play hopscotch almost every day." Teachers need to help them develop and use frequency-related terminology; for example, "I always eat spaghetti on Friday nights." or "I play hopscotch a lot." As the years go by, other probability terms will be added, such as certain, impossible, not likely, equally likely, and very likely.
To help students develop vocabulary related to data management and probability, teachers can prepare a word wall (see A Guide to Effective Instruction in Mathematics, Kindergarden to Grade 6, Volume 3, Ministry of Education). Frequency, certainty, and probability lines are also excellent tools to help students develop vocabulary related to probability.
Written Communication
Writing down ideas is usually more difficult than expressing them orally, especially for students in the Primary and Junior Divisions who are beginning to learn to write. However, there are situations where the opposite is true; for example, they can represent a set of statistical data much more succinctly and effectively with a table or graph than with an oral description. However, they need to learn to correctly use the various conventional data representations, such as frequency tables, pictographs, and bar graphs, to ensure that the message being conveyed is the right one and that it is clearly understood by others. They can then use these representations to justify their reasoning or to support an argument in a math conversation in the classroom.
In the Data strand, students have multiple opportunities to use written communication to present the results of an investigation or express their thoughts. Some examples include:
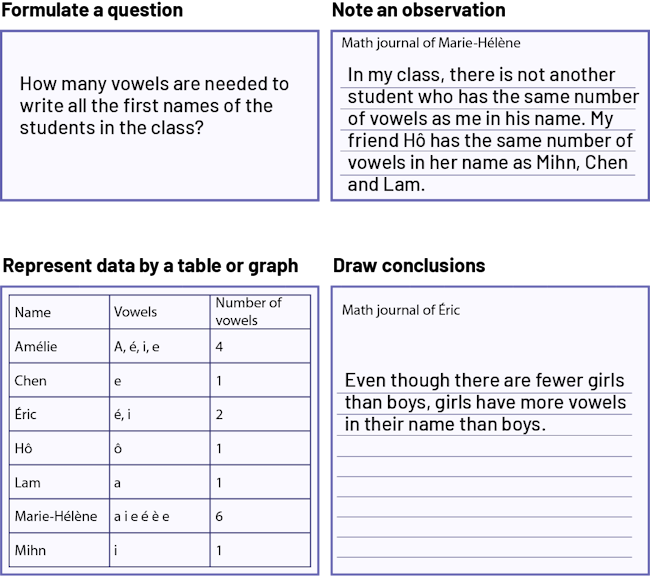 image Four written student papers.The directive for the first one is, "Formulate a question".The student wrote, "How many vowels are needed to write all the first names of the students in the class?"The directive for the second written paper is, "Note an observation". The student wrote, "Math journal of Marie-Hélène. In my class, there is not another student who has the same number of vowels as me in his name. My friend Hô has the same number of vowels in her name as Mihn, Chen and Lam."The directive for the third written paper is, "Represent data by a table or graph". There are students names listed. At each one of them, the student named the vowels and counted them.The directive for the fourth written paper is, "Draw conclusions". The student wrote, "Math journal of Éric Even though there are fewer girls than boys, girls have more vowels in their name than boys."
Source: translated from Guide d’enseignement efficace des mathématiques, de la maternelle à la 3e année, Traitement des données et probabilité, p. 19-31.
Students need direction and guidance in learning to solve problems related to data management and probability. Teachers need to have a broad view of the learning pathway that students follow and plan learning activities accordingly. They need to identify situations where it is important to use direct instruction by making sure to model their approach, questioning, and reasoning.
Teachers must also:
- provide students with a variety of engaging learning situations at an appropriate level of difficulty;
- encourage students to use concrete and pictorial representations;
- ensure that students use data management and probability terminology appropriately;
- focus on conceptual understanding;
- ask questions that help students reach a certain stage or that encourage them to reflect and clarify their thinking.
Effective instruction in the Data strand also involves the simultaneous development of students' probabilistic thinking and data literacy skills. It is important, therefore, to help students make connections between data and probability concepts. To do this, teachers should choose learning situations that will help students make these connections; for example, the teacher asks them to determine the likelihood of an event using data from a survey (Example 1) or to follow some of the steps in the inquiry process using data from a probability experiment (Example 2).
Example 1
Each student in the class reveals the month of their birthday. They then create a bar graph to represent this data. Once the data has been analyzed and the results interpreted, the teacher puts all the students' names in a bag. The teacher asks them to use the graph to determine the probability of drawing the name of a student whose birthday is in August.
(Based on the data represented in the graph, it is unlikely to draw the name of a student whose birthday is in August)
image The bar graph is titled "Monthly birthdays". The vertical axis corresponds to the months while the vertical axis, graduated from zero to ten, corresponds to the number of students. There is no bar in January. In February, the bar rises to six. In March, the bar rises to one. In April, the bar rises to five. In May, there are no bar. In June, the bar rises to one. In July, the bar rises to four. In August, the bar rises to two. In September, the bar rises to one. In October, the bar rises to two. In November, the bar rises to three. And in December, there is no bar.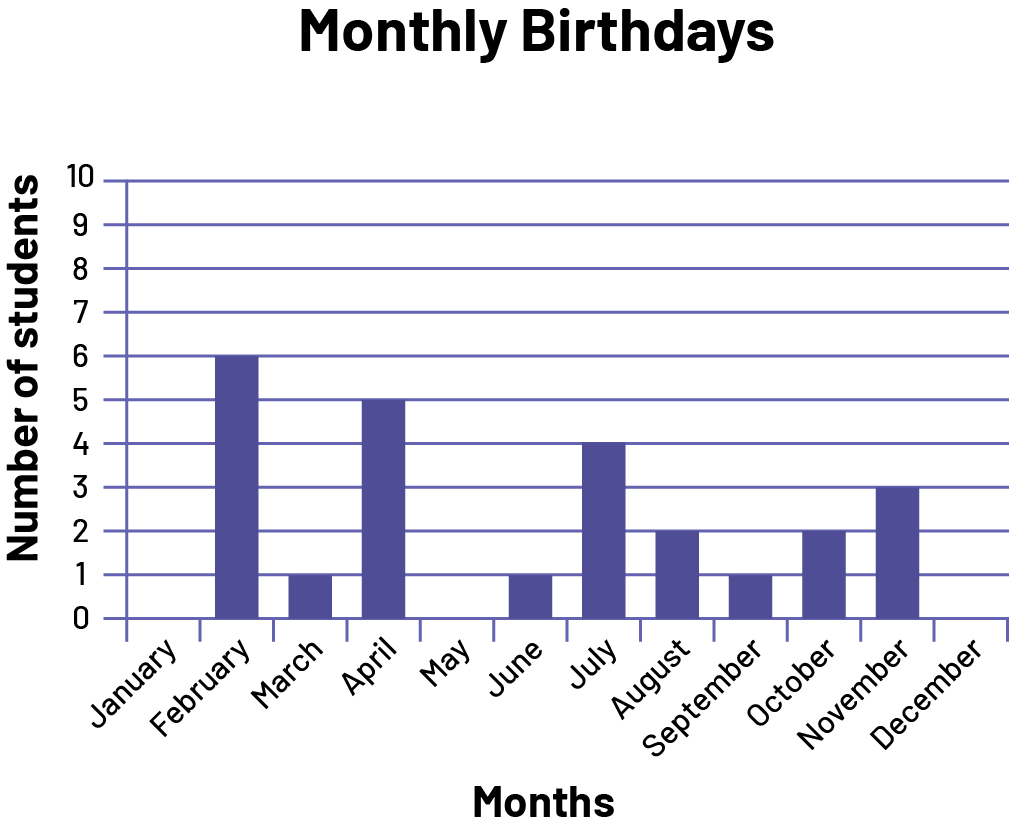
Example 2
The teacher asks students to conduct a probability experiment and record the results in a table
Source: translated from Guide d’enseignement efficace des mathématiques, de la maternelle à la 3e année, Traitement des données et probabilité, p. 31-33.
Math Conversations
A math conversation is a time to consolidate thinking, during or after learning, which goes beyond the simple exchange of ideas and strategies used by the students. During the conversation, students seek to defend their ideas and convince others of the merits of their strategies and solutions.
A math conversation is a powerful pedagogical moment in which teachers strategically lead conversations to bring out important mathematical ideas, and it lends itself well to a pedagogical approach based on the vision that students are a learning community.
Points to Consider
- To facilitate discussions during the math conversation, organize a meeting area where students can exchange ideas and make presentations, reinforcing their sense of community. The meeting area should :
- be spacious and well defined so that students can gather there to exchange ideas, discuss, and make presentations;
- be large enough for each student to move a little without disturbing the others;
- be away from storage shelves, which could be a distraction during the meeting;
- be near anchor charts to refer to, if necessary;
- be near the presentation tools.
- During the exploration, the teacher circulates among the students, observes the teams' process and listens to their discussions. These observations allow the teacher to choose the order of presentations for the conversation. This choice is guided by the teacher's goal, such as the application of a strategy and the use of a mathematical model, to ensure understanding of the concepts.
- It is not necessary to present each student's work; it is best to limit the presentation to approaches or solutions that stand out. Ask students to show their solution or approach if it is similar to the one presented, but do not explain it. Be sure to choose different students from one conversation to another.
- During the conversation, invite each team member to present his or her reflection on the work accomplished after preparing clear and convincing arguments.
- During the conversation, invite students to ask questions about the presenter's approach and explanations. This questioning encourages students to check their own understanding and helps presenters adjust their understanding as well.
- Create an atmosphere of trust and respect in the classroom where all students are encouraged to participate in activities and where all input is valued; for example, a student should feel comfortable presenting an error in his or her work as a counter-example that will help everyone's understanding.
- Ask students strategic questions to help them build a clear understanding of the concepts. Some examples include:
- Can anyone summarize the idea presented?
- How did you go about...?
- How did you overcome this difficulty?
- Why did you use this strategy?
For more information on the math conversations, see A Guide to Effective Instruction in Mathematics, Kindergarden to Grade 6, Volume 3 (Ministry of Education).
Source: translated from Guide d’enseignement efficace des mathématiques, de la maternelle à la 3e année, Traitement des données et probabilité, p. 283-284.