D1. Data Literacy
Manage, analyse, and use data to make convincing arguments and informed decisions, in various contexts drawn from real life.
Learning Situation: Yes or No?
Total duration: about 4 hours
Summary
In this learning situation, students follow the inquiry process to conduct a survey of the students in the class. They formulate a question of interest concerning a single piece of information, collect data, represent this data using a concrete graph and interpret the results.
| Overall Expectation | Specific Expectations |
|---|---|
| D1. Data Literacy
Manage, analyse, and use data to make convincing arguments and informed decisions, in various contexts drawn from real life. |
D1.2 Collect data through observations, experiments, and interviews to answer questions of interest that focus on a single piece of information; record the data using methods of their choice; and organize the data in tally tables. D1.3 Display sets of data, using one-to-one correspondence, in concrete graphs and pictographs with proper sources, titles, and labels. D1.5 Analyse different sets of data presented in various ways, including in tally tables, concrete graphs, and pictographs, by asking and answering questions about the data and drawing conclusions, then make convincing arguments and informed decisions. |
Learning Goals
The purpose of this learning situation is to have students:
- formulate a question of interest concerning a single piece of information;
- plan and conduct data collection;
- move from a personal representation of data to a more conventional one;
- interpret the results presented in a graph.
| Learning Context | Prerequisites |
|---|---|
|
Curiosity encourages young children to question themselves and those around them in order to better understand the world in which they live. Most children come to school with an intuitive understanding of simple questions that require only a yes or no answer. Previously, students had the opportunity to sort and classify objects by attribute, collect data, and represent it using concrete graphs. This learning situation allows students to continue to develop these skills by introducing them to the steps of the inquiry process. They will conduct a survey, classify the results into simple categories (for example, yes and no), and represent this data using a concrete graph (for example, red cubes for yes, blue cubes for no) and a picture graph. They will also read the data represented by a graph (for example, number of yes and no responses), compare it (for example, there are two more yes responses than no responses), and make inferences based on the data. The learning situation also allows students to appreciate the importance of using standard criteria in the construction of their graphs.
|
To complete this learning situation, students must be able to:
|
Materials
- class photo
- cardboard strips (one per pair)
- small paperclips (two per pair)
- rigid cardboard boxes for voting booths (enough for half the pairs)
- different materials to express responses to each team's survey (for example, cubes, tokens, paperclips, small cardboard pieces, clothespins)
- materials for collecting survey responses (for example, containers, rings, laces, strings)
- small cardboard boxes (one per pair)
- class lists and pencils (one per pair)
- Bristol board (one per pair)
- markers (one per pair)
Mathematical Vocabulary
survey, question of interest, data set, data collection, table, result, title, ranking criteria, attribute, category, frequencies, count, concrete graph
Before Learning (Warm-Up)
Duration: approximately 20 minutes
Have the students sit together and present them with a class photo. If possible, have several copies of the photo or scan it and present it on an interactive board so that they can see the details.
Facilitate a discussion by asking students what they observe in the photo. Examples of possible observations include:
- Four students wear glasses.
- Andre is the tallest in the class.
- There are seven students with blond hair.
- Six students are in the front row, eight students are in the second row, and nine students are in the back row.
- Some students have a design on their sweater.
- Ahmed is not in the photo.
Let the students find out as much detail as possible. Ask them if there is anything they would like to know about the other students that they cannot see in the photo. Here are some examples of possible answers:
- I would like to know the number of students who are 6 years old.
- I would like to know where the students were born.
- I would like to know which students have a sister.
- I would like to know which students like cheese.
- I would like to know how many teeth each student has lost.
- I would like to know which students play hockey.
Ask students how they might get this information. They will probably say that they would have to ask questions to students in the class. If they do not use the word survey, introduce it informally.
The content of the following sections is organized according to the four stages of the inquiry process. This breakdown is provided for the benefit of teachers. In Grade 1, these stages should not be introduced or made explicit to students. They will learn to recognize them by moving naturally from one stage to the next in the context of various investigations.
Active Learning (Exploration) - 1
Duration: approximately 15 minutes
Present the Task
In pairs, have students formulate a yes/no question to discover something they would like to know about the students in the class.
Circulate and listen to students' discussions. If students are still focusing on what they see in the photo, remind them that they should ask a question about what they do not see in it. Intervene, if necessary, by asking questions such as:
- What do you want to know?
- Can your question be answered with a yes or no? If not, how can you change it?
Make sure that all the questions are different. Write them down on the board or on a large cardboard as you go along. If two questions are the same, invite a team to formulate a new one. Use this time to select the pairs who will present their question during the mathematical exchange. If possible, select pairs whose questions are well formulated and others whose questions are not precise enough.
Consolidation of Learning - 1
Duration: approximately 15 minutes
Invite selected teams to take turns presenting their question orally to the class. Facilitate a discussion about whether the question is well-worded and easy to answer with yes or no. The table below provides examples of unclear questions with possible responses.
|
Unclear Questions |
Possible Responses |
|
Do you like food? |
Ask students if this question can be answered with a yes or no response. Some students may say that it depends on the type of food. Encourage students to formulate a more specific question. For example, ”Do you like carrots?“ |
|
Do you go to daycare after school? |
Ask students if this question can be answered with a yes or no response. Some students may answer that they only go to daycare two days a week. Have students rephrase their question more specifically, for example, ”Do you go to daycare every day after school?“ |
|
Do you like red apples or green apples? |
Ask students if they can answer yes or no to this question. Some students might answer that they like green apples, but not red apples, so they don't know if the question can be answered with a yes or a no response. Ask students to rephrase their question with only one choice, for example, ”Do you like red apples?“ |
Ask the teams to review their questions and correct them if necessary. Remind them to use capital letters at the beginning of sentences and question marks at the end. Give each pair a strip of cardboard and ask them to write their question legibly.
Active Learning (Exploration) - 2
Duration: approximately 30 minutes
Discuss with students the different methods of data collection and materials they could use to conduct their survey. If the students don't have any ideas, show them some materials they can use.
Invite each team to choose a data collection method and plan the collection. Circulate among the pairs and encourage them to think about the decisions to be made by asking questions such as:
- What materials will you use to conduct your survey? (If possible, have each team use different materials)
- How many students will answer the question?
- How will you use this material?
- How much of this material do you need? For example, in a class of 20 students, if a team uses red tokens for yes and yellow tokens for no, they will need 20 tokens of each colour, as it is possible that students in the class will answer the question the same way. However, if the team uses the same colour for both answers, they will only need 20 tokens of that colour.
Ask the teams to take turns picking up a cardboard box, the materials they have chosen for the survey, a copy of the class roster, and a pencil. Students should then place everything in the box and each team member should write their first name on one side of the box.
Collecting Data
Duration: approximately 60 minutes
Place a rigid cardboard box on a desk to form a voting booth. Explain to students that they will be asked to answer each of the questions posed by the various teams by standing behind a voting booth as if they were at a polling station. Explain to them how a polling station works, including the fact that everyone must identify themselves before voting and that their name is then taken off a list.
Explain to students the process of collecting data. The following is a suggested process.
- Direct half of the pairs to do an independent activity (for example, silent reading, individual task). Invite the remaining pairs to place a large cardboard box on a desk to form a voting booth, attach their question to the box with small bulldog clips or paperclips, and place their materials behind the box.
- When all the booths are set up, have each team member check off their name on the class list (X), and complete their own survey question using the materials.
- Then explain the procedure for conducting the survey: one member of each team will circulate to answer the various questions while the other will remain at the booth to read the question to other students or to explain how to use the materials. Then, the two team members will switch roles. There will be a signal to tell people when to move to the next booth.
- Remind them to check off their name on the list before answering, to read the posted question carefully, and to wait for the signal before going to the next voting booth.
- Ensure that all students understand the procedure. You may wish to model how to do the rotation (for example, by the order of the numbers on the cards or clockwise) and answer the next question.
- When students are finished, ask the teams that were doing the independent activity to take turns going from one booth to another to answer the questions. During this time, the teams that wrote the questions remain at their booths to ensure that the survey runs smoothly.
- When all students have completed the first set of surveys, have the original pairs carefully store their materials in a designated area without changing the response choices. These responses will be analyzed later.
- Then repeat the same process, reversing the roles of the teams, in other words, the teams that were doing an independent activity will now set up their equipment in a voting booth and vice versa.
Organize Data (Create a Graph)
Duration: approximately 30 minutes
Once the data collection is complete, discuss as a class how the results of the various surveys could be presented. Suggest that students illustrate the results by creating a graph using the materials used in the survey. You may wish to show them a picture of a concrete graph or refer to a graph they have already created. Re-form the same pairs and give each one a Bristol board. Ask them to create a graph using the materials used in the survey to represent the data collected.
At this stage, it is important for students to be able to create personal representations without being directed and led by teachers so that learning during the mathematical exchange is more meaningful.
Circulate and observe students' work. Ask questions such as:
- What material represents each category (for example, the red blocks represent the number of students who answered yes)?
- How will other students know what the various materials represent?
- How will they know how many students chose each category?
- How will they know how to match the results to the question?
Observe the graphs produced by each team and select which will be presented during the group math discussion. To help students recognize the importance of all the components of a conventional graph, include in your selection a few graphs that can be improved (for example, title or categories are missing, objects are not well arranged horizontally or vertically).
Consolidation of Learning - 2
Duration: approximately 60 minutes
When all teams have finished, invite students to sit together. Ask selected teams to present their graph to the other students in turn. After each presentation, ask students who presented their results in the same way to raise their hands. Facilitate a discussion to highlight the strengths and weaknesses of each graph.
The examples below were obtained during the testing of the learning situation and are representative of the types of difficulties that students may experience. It is up to the teacher to adapt their support according to the graphs produced by the students.
| Possible Observations | Possible Interventions |
|---|---|
 Image Box divided in two. On the Yes side, one container contains four blue chips, two yellow chips, one red chip, one black chip and one green chip. On the No side, one container contains two blue chips, one yellow chip, one red chip and one green chip. Image Box divided in two. On the Yes side, one container contains four blue chips, two yellow chips, one red chip, one black chip and one green chip. On the No side, one container contains two blue chips, one yellow chip, one red chip and one green chip.
Students arrange tokens in containers, identify categories, but do not form columns or rows |
Ask students how their classmates will be able to determine the number of results per category. Ask them if it is easy, at first sight, to determine the number of yes responses. Encourage them to form equal groups of tokens on each plate. |
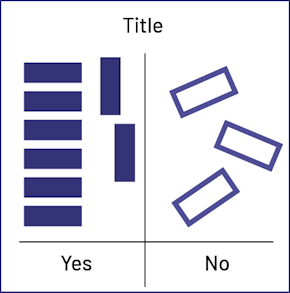 Image Box divided in two. The word “Title” is written above the box. On the Yes side of the box, six purple rectangles stacked on top of each other and two purple rectangles vertically beside them. On the No side, three white rectangles in a jumble. Image Box divided in two. The word “Title” is written above the box. On the Yes side of the box, six purple rectangles stacked on top of each other and two purple rectangles vertically beside them. On the No side, three white rectangles in a jumble.
Students form several differently oriented columns, and there is too much space |
Ask students how easy it is, at first glance, to determine the number of no responses. Encourage them to place the cards in each category in a single column, leaving no space between them. |
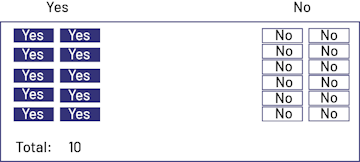 Image Two diagrams: Yes and No. The Yes chart has 11 ”Yes“ written on purple rectangles and presented in two columns. The No chart has 3 ”No's“ written on white rectangles and presented in one column. Image Two diagrams: Yes and No. The Yes chart has 11 ”Yes“ written on purple rectangles and presented in two columns. The No chart has 3 ”No's“ written on white rectangles and presented in one column.
Students write the names of the categories at the top of the graph rather than at the bottom and arrange the cards in two columns instead of one. |
Ask the students if they can determine, without counting, which category contains the most cards. Explain to them that to better compare the results, it is better to arrange the cards in each of the categories in a single column and that it is easier to read the graph when the names of the categories are placed at the bottom of each column. |
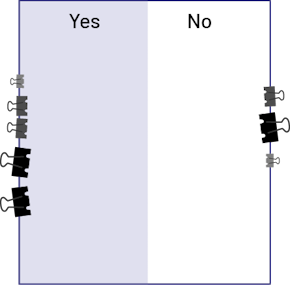
Students use different sized bulldog clips. |
Explain to the students that the graph could mislead us since the different bulldog clips do not all occupy the same space. Therefore, the length of the column of bulldog clips on each side of the Bristol board cannot be relied upon to determine whether there are more yes responses or no responses. |
Seeing that a category contains too much data for the available space, the students form two columns. |
Ask the students to find a way to place all the tokens in a category without doubling the column (for example, add a second Bristol board to the top of the first to lengthen it and affix the title on this new board). Also tell them that it would be better, in order to be able to compare the number of tokens in each column, to arrange the tokens one above the other without leaving space between them. |
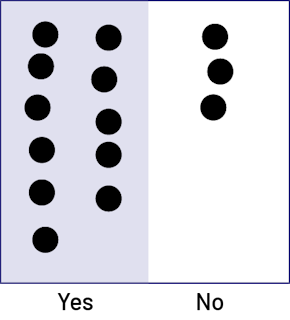
If necessary, model the construction of a graph with representative materials. Draw a horizontal line to fix the bottom of the graph (the starting point of the objects) with enough space to write the names of the categories. Draw a vertical line to separate the two categories as in the two pictures below. Explain that the first objects in each category should be placed at the bottom of the graph along the horizontal line and that the next objects should be placed on top with no gaps or overlaps (Graph A). Point out that if there are gaps between objects (Graph B), it is difficult to compare the length of each category.
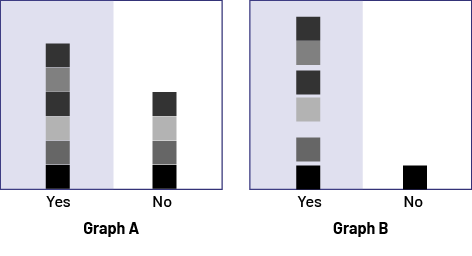 Image Two diagrams, Diagram A and Diagram B, each divided into two columns, Yes and No. Diagram A, column Yes: six stacked objects Diagram A, column No: four stacked objects Diagram B, column Yes: six objects stacked with a space between them. Diagram B, column No: one object
Also explain the importance of using objects of the same size. If the objects are not all the same size (for example, note clips of different sizes), advise them to arrange papers or cardboard of the same size side by side to form columns or rows, and then place one object on each paper or cardboard. This way, the results will be presented in an organized fashion and it will be easy to compare quantities.
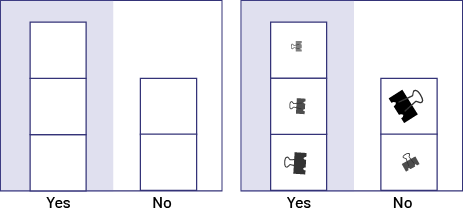 Image Two diagrams, each divided into two columns, Yes and No. In the first, three papers are stacked in the Yes column and two in the No column. In the second one, there is, on each of the three papers in the Yes column, a note clip of a different size. In the No column, there is also a note clip on each of the two papers.
Finally, point out that if a column or row is longer than the Bristol board, a second Bristol board can be added. For this reason, it is best to write the title at the end.
Ask a few students to describe in their own words the procedure you have modeled in order to identify the important elements. Invite each team to make corrections to their graphs, if necessary, to take into account the observations made during the mathematical exchange. Continue the discussion by comparing the two versions of the same graph and noting the elements that make the second version easier to interpret.
Analyze Data and Interpret Results
Use some of the concrete graphs created by students to encourage them to analyze the data and draw conclusions. Whenever possible, use both graphs with data presented in columns and graphs with data presented in rows. To help students develop skills related to interpreting the graphs, it is important to ask them questions from each of the three levels of comprehension.
- Reading the Data (level 1)
- Are all the components of the graph present? Can you show them? (Yes. Our title is the question we asked. We took red cubes to represent yes responses and green cubes to represent no responses. We arranged our cubes in columns and at the bottom we indicated the column names.)
- How do you know the answers are represented? (Each column or row is identified)
- Is it important that the columns or rows have the same starting point? Why? (Yes, it is important because it allows us to compare the results in each category without having to count all the objects)
- What can be done if the objects are not the same size? (You can put the objects on papers or cardboard of the same size, then arrange them side by side in columns or rows)
- Do the spaces between the objects have to be equal? (Yes. If the spaces are not equal, one might mistakenly think that one column is longer than another)
- How many yes responses and no responses are there?
- What do these results tell us? (They tell us that 14 students in the class were born in Canada and 10 were born in another country)
- Reading Between the Data (Level 2)
- What information can you give by comparing the results in each category? How do you know? (The majority of students in the class like cheese. I know this because the yes column is longer)
- How many more no responses are there than yes responses? How do you know? (There are 4 more no responses than yes responses. To find this out, I started counting the no responses from the end of the yes column)
- Reading Beyond the Data (Level 3)
- If the same question was asked to students in Ms. Maude's class, would the results be the same? Why? (They might be very different because it is possible that in this class there are more students who were born outside of Canada.)
- If the survey was conducted again at the end of the school year, would the results be the same? Why? (It depends on the question. For example, ”Do you have a brother?“ might generate a different response if there was a birth in the family before the end of the school year)
- Now that you have looked at the graph, what can you tell me about your survey results? (I am surprised that so many students were born in another country)
- Is there anything you didn't know from your graph? (I didn't know the country of birth for students who were not born in Canada)
- Does your survey lead you to ask yourself any other questions? What are they? (I would like to do another survey to find out if many students are born and raised in Lebanon, like me)
Extension - 1
Ask students how they might present their graph to their parents. If students suggest taking a picture, tell them that it is sometimes difficult to see the details in a picture. Have them suggest reproducing the details of their graph using pictures of the object they wish to represent. Draw their attention to the components of the graph to be reproduced. Have students form the same teams again. Give each team a large sheet of paper or cardboard and provide them with the necessary materials (for example, coloured pencils, felt pens, small squares of paper or cardboard of the same size).
The creation of a picture graph is an important step before the presentation of the pictograph where objects are represented symbolically.
Circulate among the teams and observe the students' work. Support, as needed, by asking questions such as:
- How will you represent the yes and no categories?
- What represents the yes responses? the no responses?
- How will you make sure that all pictures are the same size?
- Where will you place each picture? (Side by side, in a row or column)
- How will your parents know what your graph represents? (By reading the title.)
- Do your two graphs represent the same results? (Yes, since each object corresponds to or matches a picture)
Once all teams have finished, invite students to sit in a semicircle. Ask a few teams to present their graph and interpret what their parents will discover when they look at it. Suggest that the other students check to see if all the components of the graph are present. If any are missing, ask them to suggest changes to improve it. If necessary, ask students to correct or modify their graphs.
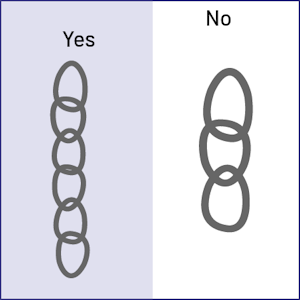
The designs of the yes links are not the same size as the no links, which can lead to misinterpretation.
Also, the categories are listed at the top of the sheet and are not at the same height.
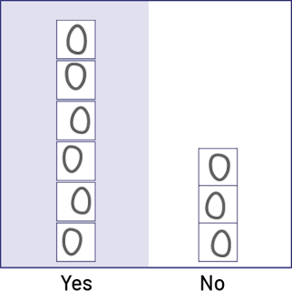
After correction, students used identical sticky notes on which they drew each link.
In addition, the category names and the starting point are located at the bottom of the graph.
Discuss with students the similarities and differences between a concrete graph and a picture graph.
Extension - 2
Explain to students that there are graphs that represent objects with the same picture. Show them examples of graphs that contain identical pictures (for example, 😀, ⭐). Point out that it is necessary to add a key to explain the meaning of the picture. Ask them to choose pictures that could replace the ones in their picture graph.
Differentiated Instruction
The learning situation can be modified to meet the different needs of the students.
|
To Facilitate the Task |
To Enrich the Task |
|
Pair students with challenges with students who can help them by explaining each step. |
|
Follow-Up at Home
Have students present their pictograph to their parents or guardians and explain the information they gathered from the surveys.
Source: translated from Guide d’enseignement efficace des mathématiques, de la maternelle à la 3e année, Traitement des données et probabilité, p. 151-168.