D1.2 Collect data through observations, experiments, and interviews to answer questions of interest that focus on a single piece of information; record the data using methods of their choice; and organize the data in tally tables.
Activity 1: Yes or No?
Over a few weeks, ask different questions that require a yes or no answer as the “question of the day.” Collect the answers in different ways (see data collection methods).
Source: translated from Guide d’enseignement efficace des mathématiques, de la maternelle à la 3e année, Traitement des données et probabilité, p. 153.
The table below shows some examples of methods that students could use.
| Examples of Data Collection Methods |
|---|
|
Place two containers on a table, one labeled yes and the other labeled no. Each student indicates their answer by placing a small object (for example, token, plastic animal, button) in the appropriate container. 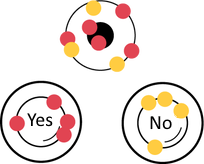 |
|
Divide a card into two columns, the yes column and the no column. Each student indicates their answer by placing a paperclip on the appropriate side. 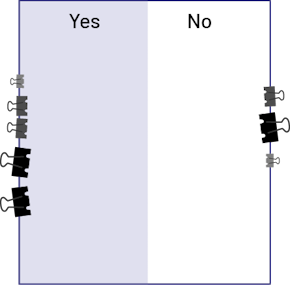 |
|
Take two hangers (or two ropes), one labeled yes and the other labeled no. Each student indicates their answer by attaching a clothes pin to the appropriate hanger. 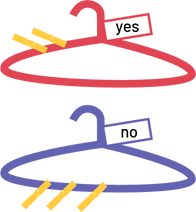 |
|
Use two laces, one labeled yes and one labeled no. Each student indicates their answer by stringing a bead on the appropriate lace. 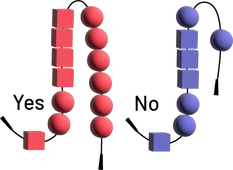 |
|
Use two rings, one for yes and the other for no. Each student writes their answer on a small card and inserts it on to the appropriate ring.  |
|
Use paperclips of different colours (for example, red to represent yes and blue for no) to form two chains. Each student adds, according to their answer, a paperclip to the appropriate chain.  |
Encourage students to think about the effectiveness of the chosen method by asking questions such as:
- Does this method capture all responses?
- How will this method verify that students completed the survey and that no one responded more than once?
- Will it be easy to determine how many students answered yes and no?
- Does this method require a lot of equipment? Which equipment?
Source: translated from Guide d’enseignement efficace des mathématiques, de la maternelle à la 3e année, Traitement des données et probabilité, p. 69-71.
Activity 2: Snack Time (Data Collection Method)
At snack time, ask students, “Do you have an apple for your snack?” Invite students to answer the question by placing a red cube in a container if the answer is yes and a blue cube if the answer is no. At the end of snack time, count the cubes of each colour. Ask questions such as:
- Do the cubes tell you how many students had an apple for a snack?
- Do the cubes tell you how many students did not have an apple for their snack?
Source: translated from Guide d’enseignement efficace des mathématiques, de la maternelle à la 3e année, Traitement des données et probabilité, p. 153.
Activity 3: Monthly Birthdays (Data Collection Method)
During a calendar activity or similar activity, ask students, “Are you celebrating your birthday this month?” Invite them to place a card with the appropriate answer, either yes or no, in a container provided. Then, count with them the yeses and the noes, then ask questions such as:
- What information do the cards provide?
- What materials other than a card could have been used to answer the question? (paperclips, stickers, tokens, etc.)
Discuss with students different ways to collect yes and no answers, encourage them to suggest some more.
Source: translated from Guide d’enseignement efficace des mathématiques, de la maternelle à la 3e année, Traitement des données et probabilité, p. 154.
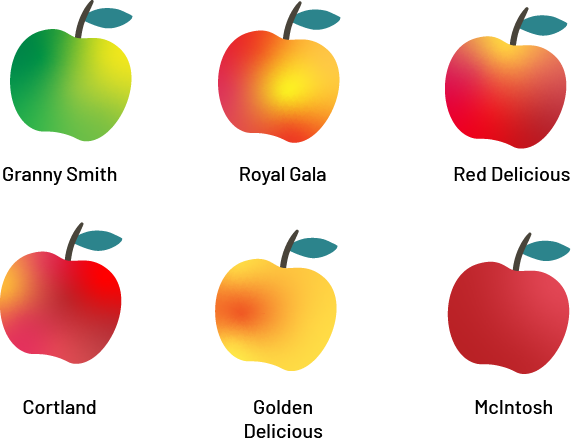
Activity 4: Apple Time (Formulation of a Question of Interest)
Present the following situation to the students.
Mrs. Pommerleau, a teacher, wants to please her students. Since it is apple harvest time, she thinks it would be a good idea to bring them some apples for their snack. She plans to bring three different varieties, but she doesn't know which ones to choose. She thinks it would be better to bring the students' favourite varieties of apples. How can she make sure she makes good choices?
To check for student understanding, ask questions such as:
- What is an apple variety? (A kind or type of apple)
- Which apple varieties do you know? (McIntosh, Granny Smith, Cortland...)
Note: If necessary, bring different varieties of apples to class to help students identify them.
- What is Mrs Pommerleau wondering about? (She wonders which three varieties of apples she should bring to her students)
- What information does she need before deciding which varieties of apples to give to her students? (She needs to know the students' favourite varieties of apples)
- How will this information help her make a decision? (By determining the top three favourite varieties of apples, she will then know which apples to bring)
- How would she get this information? (She could conduct a survey to the entire class)
For example, the question of interest might be, “What are the three favourite varieties of apples in Mrs. Pommerleau's class?” But a question such as, “How many different varieties of apples do the students know?” would be of no use since the answer would not help Mrs. Pommerleau choose which varieties of apples to bring to her students.
For example, as a follow-up to the question of interest, “What are the three favourite varieties of apples in Ms. Pommerleau's class?” a survey question could be asked, “What is your favourite variety of apple?”
Source: translated from Guide d’enseignement efficace des mathématiques, de la maternelle à la 3e année, Traitement des données et probabilité, p. 59-62.
Activity 5: Where Were You Born?
In a discussion, a student wonders how many students in the class were born outside of Canada. Take advantage of the situation to point out that this is a good question of interest. Then suggest that the students conduct a survey and ask them how the survey question could be worded.
Write some of the statements on the board and encourage students to think about possible interpretations of each. For example, one of the proposed questions could be: “Where were you born?” Then ask the students if the question is clear. Most of them might think so. Then explore the kinds of answers that could be obtained by this question. Some might say that one would get the name of a country, while others might think of a city name instead. Home or hospital could be answers too, depending on the student. The students should then realize that the question is open to interpretation and that it would benefit from being reworded in order to better target the type of answer desired. Students could suggest the question “In which country were you born ?” or “Were you born in Canada?“
Encourage students to check with a few respondents to see if the wording of a survey question actually produces the kind of response expected. Discuss the idea that a large number of responses can be generated by a question, which may make data collection, recording, and analysis more difficult. In such cases, it may be advantageous to use a multiple choice question.
Activity 6: My Reading Preferences
Suggest to students that they conduct a survey to determine the reading preferences of elementary school students in order to suggest books to be purchased for the school library. Guide students in developing a survey question.
Here are some examples of student-proposed survey questions with possible observations.
| Question | Observations |
|---|---|
| What is your favourite kind of book? | This question can be difficult to understand if one does not know how to describe different kinds of books. It can therefore generate quite a large number of different responses and complicate the task of drawing conclusions about students' preferences. |
| Do you like to read fairy tales? | This question is clear and does not seem open to interpretation. In addition, it facilitates data collection since the only two anticipated answers are yes and no. It shows how many students like or dislike fairy tales, but it gives no information about students' preferences for other kinds of books. |
What would be your first choice of book among the following?
|
This multiple-choice question reduces the number of possible answers, allowing for more effective organization and interpretation, and limits the choice to text genres that students are familiar with from their primary school years. |
Source: translated from Guide d’enseignement efficace des mathématiques, de la maternelle à la 3e année, Traitement des données et probabilité, p. 64.
Activity 7: A Three-Column Table (Data Collection Method)
Ask students to identify their favourite activity (for example, play field hockey, ride a bike, practice judo). To record the responses, have students prepare a table with three columns, one for each activity. As students answer the survey question, encourage them to write the first letter of the chosen activity in the appropriate column.
Source: translated from Guide d’enseignement efficace des mathématiques, de la maternelle à la 3e année, Traitement des données et probabilité, p. 72.
Activity 8: Broccoli (Data Recording)
Instruct students to conduct a survey with the question, ”Do you like broccoli?“ Students offer a choice of three responses: yes, no , and I have never eaten it. Ask students to find an effective recording method to record responses as they collect them. For example, students could use a class list on which they indicate, in the box adjacent to each name, the response they have chosen: a check mark (√) for yes, an ”X“ for no, a fully coloured box for I have never eaten it.
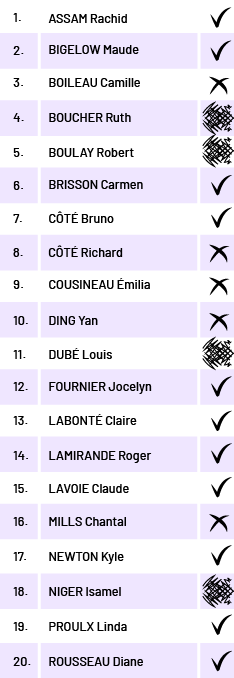 Image The table contains twenty names all associated with five boxes marked either with check marks, ”X’s“, or blackened.Assam, Rachid. All five boxes are checked. Bigelow, Maude. All five boxes are checked. Boileau, Camille. All five boxes are marked with an ”X“. Boucher, Ruth. All five boxes are blackened. Boulay, Robert. All five boxes are blackened. Brisson, Carmen. All five boxes are checked. Côté, Bruno. All five boxes are checked. Côté, Richard. All five boxes are marked with an ”X“. Cousineau, Emilia. All five boxes are marked with an ”X“. Ding, Yan. All five boxes are marked with an ”X“. Dubé, Louis. All five boxes are blackened. Fournier, Jocelyn. All five boxes are checked. Labonté, Claire. All five boxes are checked. Lamirande, Roger. All five boxes are checked. Lavoie, Claude. All five boxes are checked. Mills, Chantal. All five boxes are marked with an ”X“. Newton, Kyle. All five boxes are checked. Niger, Ismael. All five boxes are blackened. Proulx, Linda. All five boxes are checked. Rousseau, Diane. All five boxes are checked.
Source: translated from Guide d’enseignement efficace des mathématiques, de la maternelle à la 3e année, Traitement des données et probabilité, p. 73.
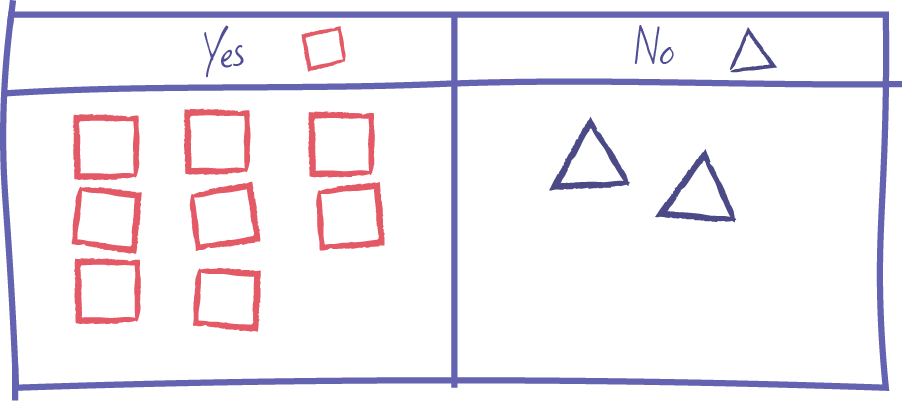
Activity 9: Data Collection and Recording
Suggest that students conduct a survey to determine the number of students in the class who like to play outside. Encourage students to use effective data collection methods. For example, team members could ask each student to draw, in the appropriate column of a table, a square if the answer is yes and a triangle if the answer is no. This method would allow them to conduct both data collection and recording.
Source: translated from Guide d’enseignement efficace des mathématiques, de la maternelle à la 3e année, Traitement des données et probabilité, p. 73.