D1.3 Display sets of data, using one-to-one correspondence, in concrete graphs and pictographs with proper sources, titles, and labels.
Activity 1: From Personal Representation to More Conventional Representation
The two examples below illustrate how teacher questioning helps students move from a personal representation of the data to a more conventional one.
 Image
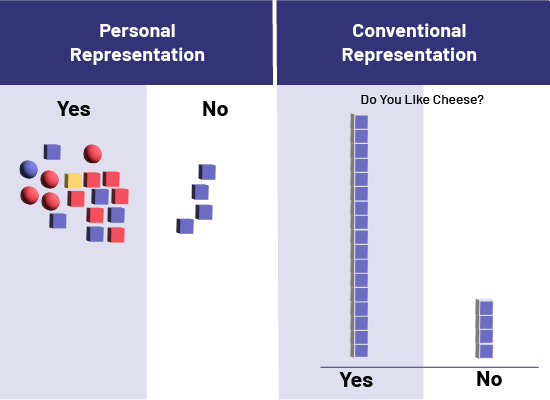
Two tables with two columns, the first for Yes and the second for No. Title of the first table: Personal
Representation In the Yes column, 17 logical blocks of different shapes and colors. In the No column, 4 logical blocks
of square shape and blue color. Title of the second table: Conventional Representation. The question is, Do you like
cheese? In the column Yes, eight logical blocks of square shape and blue color. In the column No, four logical blocks
of square shape and blue color.
Image
Two tables with two columns, the first for Yes and the second for No. Title of the first table: Personal
Representation In the Yes column, 17 logical blocks of different shapes and colors. In the No column, 4 logical blocks
of square shape and blue color. Title of the second table: Conventional Representation. The question is, Do you like
cheese? In the column Yes, eight logical blocks of square shape and blue color. In the column No, four logical blocks
of square shape and blue color.
- Why is it useful to place the question above the graph? (It helps to know what the graph represents)
- Is it possible to determine the categories into which the data have been grouped? (Yes, these are clearly indicated by the words yes and no.)
- How could you arrange the objects in your graph to make it easier to count them? (I could line them up in columns)
- Where should objects be placed when constructing a graph? Why? (They are placed starting from the bottom of the column so that the height of each column can be compared)
- Why should objects of the same dimensions (for example, interlocking cubes) be used to create the graph? (This allows you to see at a glance which category has the most objects. If the objects are not the same size, you cannot rely on the length of the columns unless you place the objects in a grid)
- When creating a graph, where do you usually place the category names? (Usually at the bottom of the columns or to the left of the rows)
- Can someone reading your graph know what it represents? Why? (No, because there is no title to the graph.)
Source: translated from Guide d’enseignement efficace des mathématiques, de la maternelle à la 3e année, Traitement des données et probabilité, p. 90.
Activity 2: Concrete Graph
Propose the question of interest below and guide the students while they collect and represent the data.
| Question of Interest | What is the students’ favourite stuffed animal? |
| Type of Inquiry | Survey |
| Type of Information Sought | Preference |
| Grouping of Data | Nominal categories |
| Data Representation | Stuffed animals, based on a one-to-one correspondence. |
| Concrete Graph | 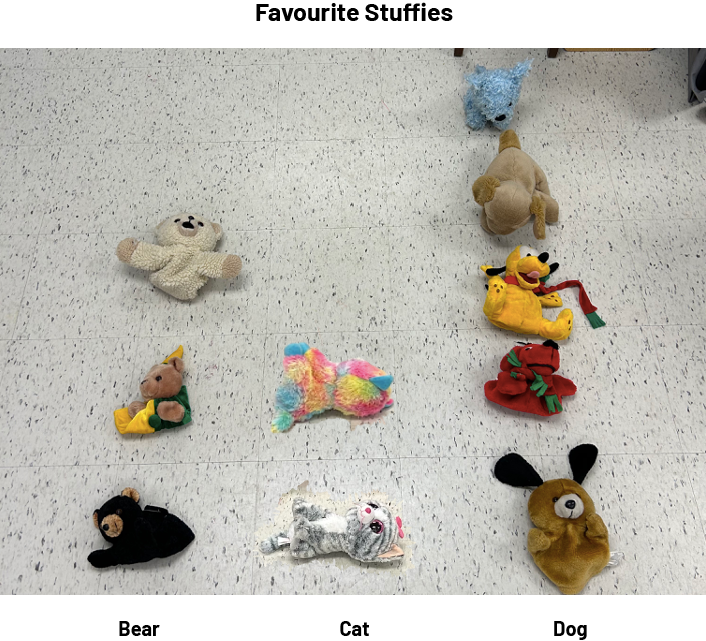 |
Sample questions:
- How can the data be collected? By observation, by survey, by experiment?
- Are we looking for general information or a preference among people?
- Using which attribute will the categories be formed? What is the attribute described by the categories? (qualitative data or quantitative data)
- How can we represent the data? By real objects (concrete graph), objects that represent the data (graph with representative material), images of the objects (picture graph) or the same image for all the objects (pictograph)?
Source: translated from Guide d’enseignement efficace des mathématiques, de la maternelle à la 3e année, Traitement des données et probabilité, p. 92.
Activity 3: Graph With Representative Material
Propose the question of interest below and guide the students while they collect and represent the data.
| Question of Interest | What material are the student pencil cases in the class made of? |
| Type of Inquiry | Observation |
| Type of Information Sought | General Information |
| Grouping of Data | Nominal categories |
| Data Representation | Interlocking cubes, in a one-to-one correspondence. |
| Graph with Representative Material | 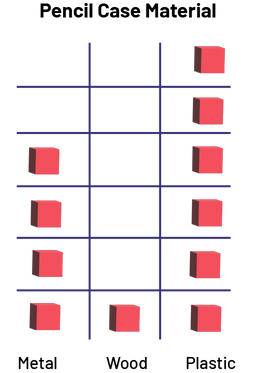 Image Diagram with representative material, titled The Pencil Case Material, formed by three
columns: the Metal column, which has four red blocks, the Wood column, which has one red block, and the
Plastic column, which has six red blocks. Image Diagram with representative material, titled The Pencil Case Material, formed by three
columns: the Metal column, which has four red blocks, the Wood column, which has one red block, and the
Plastic column, which has six red blocks. |
Sample questions:
- How can the data be collected? By observation, by survey, by experiment?
- Are we looking for general information or a preference among people?
- Using which attribute will the categories be formed? What is the attribute described by the categories? (qualitative data or quantitative data)
- How can we represent the data? By real objects (concrete graph), objects that represent the data (graph with representative material), images of the objects (picture graph) or the same image for all the objects (pictograph)?
Source: translated from Guide d’enseignement efficace des mathématiques, de la maternelle à la 3e année, Traitement des données et probabilité, p. 93.
Activity 4: Picture Graph
Propose the question of interest below and guide the students while they collect and represent the data.
| Question of Interest | What types of shoes do teachers at the school wear? |
| Type of Inquiry | Observation |
| Type of Information Sought | General Information |
| Grouping of Data | Nominal categories |
| Data Representation | Shoe pictures, one-to-one correspondence |
| Picture Graph | 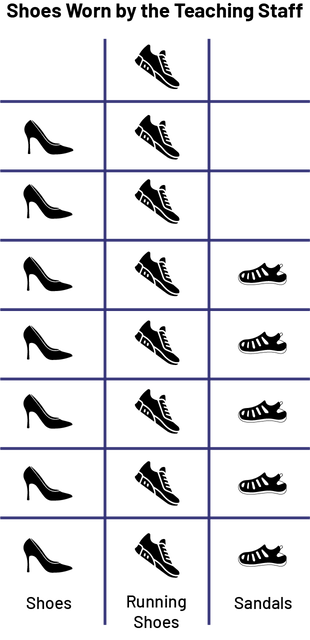 Chart with illustrations, titled Shoes Worn by the Teaching Staff, formed with three
columns: the Shoes column, which has seven pumps, the Running Shoes column, which has eight sneakers, and
the Sandals column, which has five sandals. Chart with illustrations, titled Shoes Worn by the Teaching Staff, formed with three
columns: the Shoes column, which has seven pumps, the Running Shoes column, which has eight sneakers, and
the Sandals column, which has five sandals. |
Sample questions:
- How can the data be collected? By observation, by survey, by experiment?
- Are we looking for general information or a preference among people?
- Using which attribute will the categories be formed? What is the attribute described by the categories? (qualitative data or quantitative data)
- How can we represent the data? By real objects (concrete graph), objects that represent the data (graph with representative material), images of the objects (picture graph) or the same image for all the objects (pictograph)?
Source: translated from Guide d’enseignement efficace des mathématiques, de la maternelle à la 3e année, Traitement des données et probabilité, p. 94.
Activity 5: Pictograph
Propose the question of interest below and guide the students while they collect and represent the data.
| Question of Interest | When two dice are rolled, what is the most likely result? |
| Type of Inquiry | Probability experiment |
| Type of Information Sought | Quantity |
| Grouping of Data | Numerical categories |
| Data Representation | One picture or icon, one-to-one correspondence |
| Pictograph | 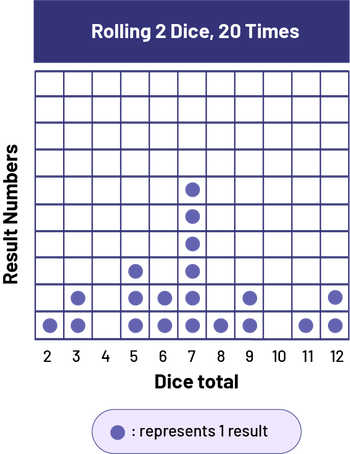 Image Diagram with illustrations, titled Rolling two dice, formed by a grid of 110 cells.
Title of the vertical axis: Result Numbers. Title of the horizontal axis: Dice total Horizontal axis
numbered from 2 to 12. Column 2: one chip Column 3: two chips Column 4: zero chipsColumn 5: three
chipsColumn 6: two chips Column 7: six chips Column 8: one chipColumn 9: two chips Column 10: no chips
Column 11: one chipColumn 12: two chipsLegend: each chip represents one result Image Diagram with illustrations, titled Rolling two dice, formed by a grid of 110 cells.
Title of the vertical axis: Result Numbers. Title of the horizontal axis: Dice total Horizontal axis
numbered from 2 to 12. Column 2: one chip Column 3: two chips Column 4: zero chipsColumn 5: three
chipsColumn 6: two chips Column 7: six chips Column 8: one chipColumn 9: two chips Column 10: no chips
Column 11: one chipColumn 12: two chipsLegend: each chip represents one result |
Sample questions:
- How can the data be collected? By observation, by survey, by experiment?
- Are we looking for general information or a preference among people?
- Using which attribute will the categories be formed? What is the attribute described by the categories? (qualitative data or quantitative data)
- How can we represent the data? By real objects (concrete graph), objects that represent the data (graph with representative material), images of the objects (picture graph) or the same image for all the objects (pictograph)?
Source: translated from Guide d’enseignement efficace des mathématiques, de la maternelle à la 3e année, Traitement des données et probabilité, p. 95.