D1.4 Order categories of data from greatest to least frequency for various data sets displayed in tally tables, concrete graphs, and pictographs.
Activity 1: Order Data From a Tally Table
Present students with the ”Means of Transportation Used to Get to School by Class 1A Students“ tally table.
| Means of Transportation Used to Get to School by Class 1A Students | |
|---|---|
| Bicycle |  |
| School bus |  |
| Car |  |
| Walk |  |
Ask students to order the data by frequency, from highest to lowest.
To guide students' thinking, ask questions such as:
- Where will you start?
- How do you know that this is the highest? How do you know this is the lowest?
- What do the four vertical tallies and the horizontal tally mean?
- Which mode of transportation is most used by students in Class 1A? Which is least used?
Possible observations
Students count the number of tallies in each category, build towers of interlocking cubes for each category, compare them, and order them.
Activity 2: Order Data From a Pictograph
Present students with the pictograph ”Number of Protein Foods in Grade 1 Student Lunch Boxes.“.
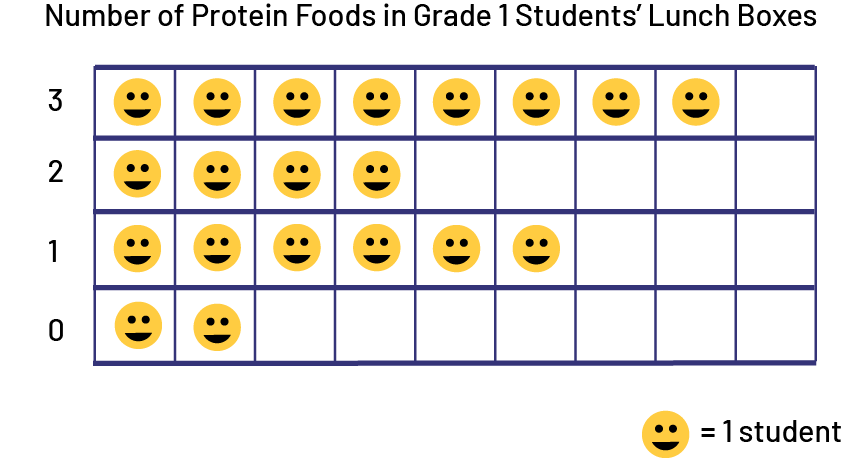 image Pictograph chart, titled “Number of Protein Foods in Grade One Student Lunch Boxes”, made of four rows numbered 0 through 3. Row 0: two smiley faces Row 1: Six Smileys Row 2: four smileys Row 3: eight smileys Legend: one smiley face equals one student Image Pictograph chart, titled “Number of Protein Foods in Grade One Student Lunch Boxes”, made of four rows numbered 0 through 3. Row 0: two smiley faces Row 1: Six Smileys Row 2: four smileys Row 3: eight smileys Legend: one smiley face equals one student
Ask students to order the data by frequency, from highest to lowest.
To guide students' thinking, ask questions such as:
- Where will you start?
- How do you know that this category is the highest? How do you know this is the lowest?
- How many protein foods are in most lunch boxes?
Possible observations
Students count the number of smileys in each category, use the grid to compare, and order the categories.