D1.5 Analyse different sets of data presented in various ways, including in tally tables, concrete graphs, and pictographs, by asking and answering questions about the data and drawing conclusions, then make convincing arguments and informed decisions.
Activity 1: False Conclusions
Present students with the picture graph that one team created as part of a survey. The graph represents students' responses to the survey question, ”What is your favourite animal: cat, dog, or hamster?“.
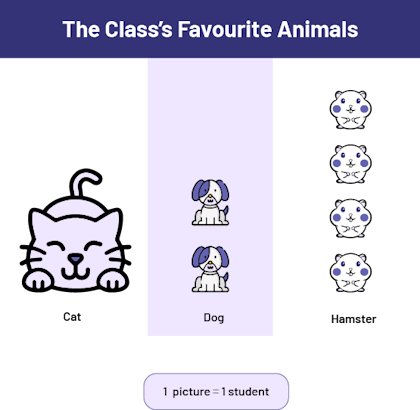 Image Chart with illustrations, titled The Class’s Favourite Animals, made up of three columns: the Cat column, which has one cat, the Dog column, which has two dogs, and the Hamster column, which has four hamsters. Legend: One illustration represents one student.
When analyzing the data, lead students to recognize that the graph may lead to the conclusion that the cat is the students' favourite animal since it is the largest picture. Ask them:
What should be done to prevent the graph from leading to false conclusions? (The same size pictures should be used or the pictures should be placed in a grid)
Source: translated from Guide d’enseignement efficace des mathématiques, de la maternelle à la 3e année, Traitement des données et probabilité, p. 110-111.
Activity 2: Coco Farm Animals (Misleading Graphs)
Materials
- Appendix 1.1 (1 copy per team).
- Appendix 1.2 (1 copy per team).
- Large cardboard (1 per team)
- Glue sticks (1 per team)
Summary
In this activity, students become aware that the pictures must be the same size to allow for proper interpretation of the data in an picture graph.
Directions
Form teams. Give each team an envelope containing pictures of farm animals (see Appendix 1.1) as well as a large piece of cardboard and a stick of glue. Invite students to create a graph using the pictures to compare the number of cows, chickens, pigs and sheep on the Coco farm.
When all teams have finished, invite students to sit in a semicircle. Display all graphs and ask questions to encourage students to interpret them.
Examples
- When you look at the graphs, what do they tell you about the chickens? Why? (There are more chickens because the chicken column is the longest.)
- Is it true that there are more chickens than other animals? How do you know? (No, it's not true. When I count, I see that there are only three chickens, but there are four cows and five sheep.)
- Why is the row (or column) of chickens longer than the row (or column) of cows? (Because the pictures of chickens are larger)
- What should be done to correct this graph?
Students should quickly become aware of the problem they are facing. When they suggest using the same size pictures, provide them with the set of pictures in Appendix 1.2 or post the set of pictures on the interactive whiteboard. Create the graph as a class. Compare the new graph with the first one, using the same questions.
Source: translated from Guide d’enseignement efficace des mathématiques, de la maternelle à la 3e année, Traitement des données et probabilité, p. 168-169.
Activity 3: Talking Stickers (Analysis of a Pictograph)
Materials
Appendix 1.4 (1 copy per student of any of the three graphs).
Summary
In this activity, students read and interpret a pictograph and draw conclusions.
Directions
Form teams. Give each team one of the pictographs in Appendix 1.4. If each team needs a different graph, prepare other similar ones. Ask each team to read the graph and find as much information as possible.
As students discuss in teams, circulate and ask questions such as:
- What do you see in your graph?
- Do you know how many students are in this class?
- How do you know what each picture represents?
- Why are there no pictures in the bus column of your graph? (Our Preferred Means of Transportation)
When all teams have finished, invite each team to present its graph and interpret it. After each presentation, ask the other teams to complete the interpretation of the graph by asking questions that will not only encourage them to read the data, but also compare, combine, and make inferences about the information.
Source: translated from Guide d’enseignement efficace des mathématiques, de la maternelle à la 3e année, Traitement des données et probabilité, p. 170.