D1. Data Literacy
Manage, analyse, and use data to make convincing arguments and informed decisions, in various contexts drawn from real life.
Learning Situation: Spotlight on Recycling
Total duration: approximately 2 hours
Summary
In this learning situation, students conduct a survey to determine the type of material that is found in greatest quantities in recycling bins. This survey allows them to practise their knowledge of data collection and recording, and to become aware of the importance of their role in the preservation of natural resources.
| Overall Expectation | Specific Expectations |
|---|---|
| D1. Data Literacy
Manage, analyse, and use data to make convincing arguments and informed decisions, in various contexts drawn from real life. |
D1.3 Display sets of data, using one-to-one correspondence, in concrete graphs, pictographs, line plots, and bar graphs, with proper sources, titles, and labels. D1.5 Analyse different sets of data presented in various ways, including in logic diagrams, line plots, and bar graphs, by asking and answering questions about the data and drawing conclusions, then make convincing arguments and informed decisions. |
Learning Goals
The purpose of this learning situation is to enable students to:
- classify objects according to various characteristics;
- record and interpret data;
- make and communicate conclusions, conjectures, and recommendations.
| Learning Context | Prerequisites |
|---|---|
|
In Grade 2, students collect primary data as part of the inquiry process and record it in a table. This learning situation allows them to understand that the frequency table is an effective way to record the results of a count. It also allows them to make connections between the recycling activity and certain social values linked to the preservation of the environment. |
To complete this learning situation, students must be able to:
|
Mathematical Vocabulary
survey, classify, attribute, characteristic, data collection, primary data, record data, category, tally table, title
Materials
- recycling bins with different recyclables (one for demonstration and one for each team of four)
- large sheets of paper (two for the class and two per team)
- plastic tablecloth
- plastic gloves (one pair per team)
Preparatory Activity
Duration: approximately 45 minutes
Prepare a recycling bin with about 30 recyclable items (for example, milk carton, water bottle, wrapping paper). Make sure that most items are made from a single type of material while some are made from two types of materials (for example, cardboard juice container with plastic cap).
Place the bin in front of the class. Draw students' attention to the logo printed on the bin and discuss with them:
- its meaning (in other words, indicates that only recyclables should be placed in the bin);
- its function (for example, to encourage people to separate recyclable from non-recyclable waste);
- other places where it is found (for example, on various products to indicate that they are recyclable or made in part from recycled materials);
- the importance of recycling (for example, avoid overloading landfills; reduce consumption of raw materials);
- what happens to the contents of the recycling bins after collection (for example, items are taken to a sorting facility where they are separated according to types of materials).
Invite students to act as if they were at a sorting center. Empty the contents of the bin onto a plastic tablecloth and ask them to identify some of the objects and types of materials. Determine with the students the categories into which the objects can be sorted (for example, paper, plastic, cardboard, cardboard and plastic). Give two students plastic gloves and ask them to divide the objects from the bin into the categories determined. Invite the other students to intervene if an object is not sorted correctly.
Tell students that it would be interesting to know the type of material that is found in the greatest quantity in the recycling bins. Suggest that they could first get an idea of this by considering the classification of objects on the tablecloth. Form teams of two students and give each team a large sheet. Ask them to find a way to represent the classification of objects.
At this stage, it is important for students to be able to use a personal mode of recording data without teacher direction.
Circulate and intervene as needed, asking questions such as:
- Have you recorded all the items on the tablecloth?
- What does the data on your sheet represent?
- With this representation, do we have all the necessary information about each category of objects?
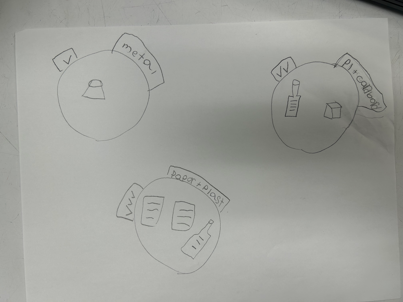
Here are some examples of data records used by students.
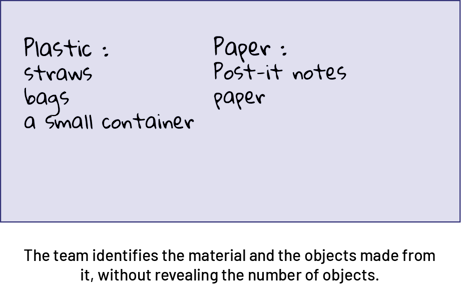 Image Two lists written: the first is for plastic, and contains straws, bags, and a small container; the secondis for paper, and contains post-it notes and paper. Under the lists, it is written, “The teaching staff identifies the material and the objects made from it, without revealing the number of objects.”
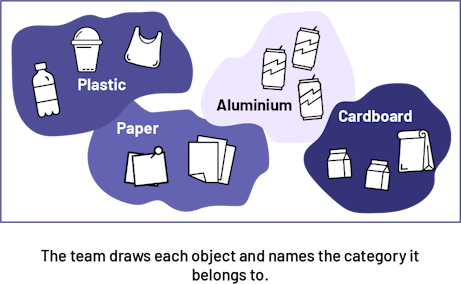 Image Four groups of objects: plastic, which contains a bottle, a cup, and a bag; paper, which contains post-itnotes and paper sheets; aluminum, which contains three cans; and cardboard, which contains two berlingots and abag. Under the groups of objects, it is written, “The teaching staff draws each object and names the category it belongs to.”
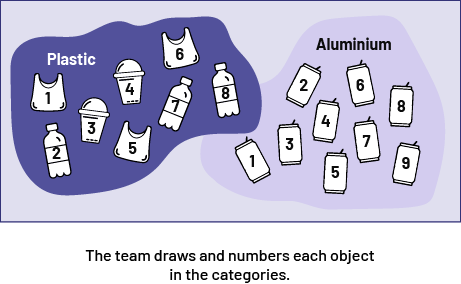
Image Two groups of objects: plastic, which contains three bags, three bottles and two cups, all numbered, and aluminum, which contains eight cans, also all numbered. Under the groups of objects, it is written, “The teaching staff draws and numbers each object in the categories.”
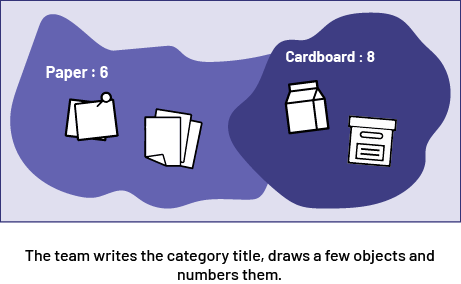
Image Two groups of objects: paper, which contains six objects, or three groups of two post-it notes, andcardboard, which contains eight objects, or four bags and four berlingots. Under the groups of objects, it is written, “The teaching staff writes the category title, draws a few objects and numbers them.”
Display a few pieces of work that illustrate different ways of recording data and discuss with students the advantages and disadvantages of each (for example, it is very time-consuming to draw each object; it is helpful to clearly indicate the number of objects in each category). Place the objects back in the bin and keep it for the Warm-Up.
Before Learning (Warm-Up)
Duration: approximately 20 minutes
Explain to students that it is not necessary to classify all the objects if you just want to know how many objects are in each category of material. Explain that it is possible to remove one object at a time from the bin and record the material it is made of in a table.
On a large sheet of paper, draw a three-column table like the one shown below, and write the titles of the first two columns (Materials, Count). The third column will be used to add the frequencies.
| Materials | Count | |
|---|---|---|
Return to the recycling bin used in the pre-activity and model the use of a tally table and a frequency table. It involves removing one object from the bin at a time, indicating in the first column the category it corresponds to (for example, paper) and placing a check mark (√) in the corresponding row of the second column.
| Materials | Count | |
|---|---|---|
| paper | √ √ √ √ √ √ √ √ √ | |
| plastic | √ √ √ √ √ √ √ √ √ | |
| cardboard | √ √ √ √ √ √ √ √ √ √ √ √ √ √ | |
| plastic and cardboard combined | √ √ | |
| plastic and paper combined | √ √ | |
| metal | √ √ | |
| metal and plastic combined | √ | |
When the count is complete, ask the following questions:
- What observations can be made from this data? (For example: In the bin, there is more cardboard than any other material. There are few metal objects.)
- How could we find out the number of objects in each category without having to count all the check marks each time? (The number of check marks for each category could be written in the third column of the chart.)
Instruct students that the number of check marks in each category is called the category frequency. Have a student write the title Frequency at the top of the column and the total number of objects counted in each category in the appropriate place.
Encourage students to compare the frequency table to the data recording method used in the preparatory activity. Discuss with students the advantages of recording and presenting data using such a table (for example, a quick and effective way to communicate the essential information about the contents of the recycling bin).
Active Learning (Exploration)
Duration: approximately 30 minutes
Group students into teams of four and have them conduct a survey to determine the most common recyclable material found in the school's recycling bins. Give each team a large sheet of paper, a pair of gloves, and a recycling bin containing about 30 items of different materials. Fill bins ahead of time. Vary the types of materials in each bin, for example:
| Bin 1 | Bin 2 | Bin 3 | Bin 4 | Bin 5 |
|---|---|---|---|---|
|
|
|
|
|
Ask each team to represent the contents of their bin on the sheet. Circulate among the students and ask them questions such as:
- Why did you choose these categories?
- In which categories are objects more difficult to count? Why?
Choose, for the mathematical discussion, different representations used by the students.
Consolidation of Learning
Duration: approximately 30 minutes
Invite the selected teams to take turns presenting and explaining their method of recording data to the whole class. Ask the other students to compare the various methods used and to indicate what information about the contents of the bins they can glean from the data presented.
Here are some examples of data records used by students.
The team does not create a frequency table but uses some of its components (a frequency checkmark for each category, for example).
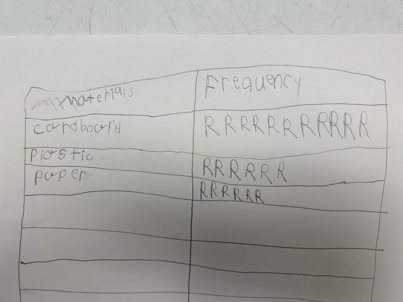
The team uses a symbol to indicate frequency (for example, R for recycling).
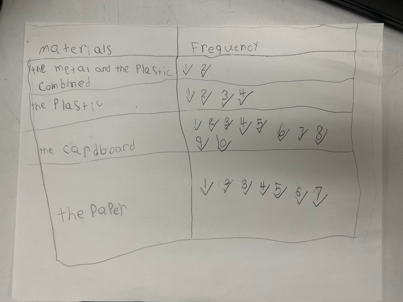
The team uses checkmarks for frequency, and adds the numbers to calculate the total.
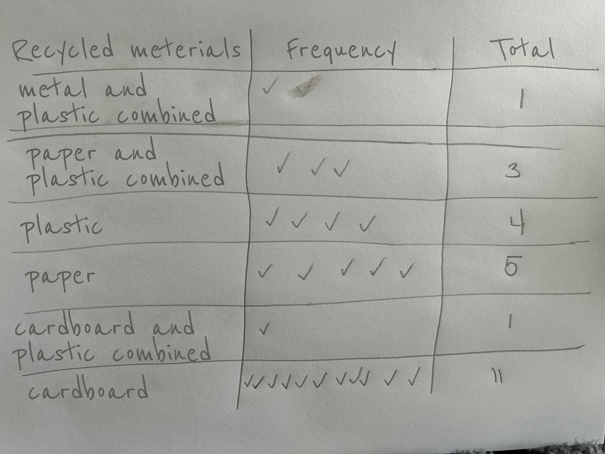
Image Table of the numbers that a team has made, where the check marks are used to show the counting of the following: Metal and combined plastics Cardboard Paper and combined plastics Plastic Paper Cardboard and combined plastics.
The team presents a complete table containing totals.
Next, discuss with students how the data collected by each team could be used to determine which recyclable material is found most in the bins. Have them suggest that all the data be combined into one frequency table. Draw this table on a large sheet of paper and have each team record the frequencies. Then determine the total frequencies for each category of material.
Encourage students to analyze the data by asking questions that address each of the three levels of comprehension.
Reading the Data (level 1)- What is the title of the frequency table?
- What is the frequency of each category?
- What type of recyclable material is most commonly found in the bins?
- Is there more plastic or cardboard in the bins?
- If we grouped all the objects composed of two materials in the same category called 'other', would this category be the one with the greatest frequency?
- Why are the frequencies of the same category different from one team to another?
- Do you recycle the same materials at home? Why?
- Based on the data, what recommendations could you make? (You could make sure to use both sides of the paper before recycling it. You could reuse some of the items for craft activities. You could make more effort to recycle items that are made of two materials, since these categories of items have the lowest frequencies)
Extension - 1
Display one of the frequency tables created by the teams during the learning situation in which counting is done using check marks (√). Point out to the students that when the number of check marks is high, it can be difficult to count them without making mistakes. Suggest that they replace the check marks with tally marks. Redo the frequency table by modelling the use of tally marks. Point out that it is now easier to count the number of marks since they cancount by 5s.
Display a second frequency table and ask students to represent the same data in a frequency table using tally marks rather than check marks.
Extension - 2
Have students create a bar graph or pictograph to represent the data that were collected by the teams in the learning situation.
Extension - 3
Prepare and ask questions to the custodian or school recycling team to find out what happens to the items put in the recycling bins. If possible, arrange a visit to a recycling centre to see how items are sorted.
Differentiated Instruction
The learning situation can be modified to meet the different needs of the students.
| To Facilitate the Task | To Enrich the Task |
|---|---|
| Provide students with a template of the frequency table with the name of each category already written in. | Have students create a pictograph or bar graph to represent the data in their frequency table. |
Follow-Up at Home
At home, students can make a craft out of recycled materials and record in a chart the quantity of each type of material used.
Source: translated from Guide d’enseignement efficace des mathématiques, de la maternelle à la 3e année, Traitement des données et probabilité, p. 197-206.