D1.1 Sort sets of data about people or things according to two attributes, usingtables and logic diagrams, including Venn and Carroll diagrams.
Skill: Sorting and Classifying Sets of Data
Sorting involves grouping objects that have a common characteristic (for example, objects that are large) and discarding those that do not (for example, objects that are not large).
Classifying involves the identification of a common attribute among all items within a group (for example, size). Items are then categorized according to different characteristics of that attribute (for example, large, medium, small).
These two skills develop almost simultaneously. The close relationship between sorting and classifying often makes it difficult to observe the two skills separately. To facilitate this observation, teachers should choose contextualized problems that make greater use of either sorting or classifying.
Sorting and classifying skills include the ability to:
- determine classes from at least one attribute;
- group objects appropriately in these classes.
To sort and classify objects, students must first be able to select objects that share a common characteristic and discard those that do not. Students can also sort the discarded objects into other classes. It is important that students have opportunities to sort and classify the same objects in a variety of ways.
An activity that requires defining classes using the linking word or (for example, triangles or squares) is a complex activity.
Source: translated from Guide d’enseignement efficace des mathématiques, de la maternelle à la 3e année, Traitement des données et probabilité, p. 36-37.
Sorting and Classifying Representations
In the initial sorting and classifying experience, educators should allow students to use personal representations (for example, concrete materials, drawings) before exposing them to representations using conventional graphs (for example, Venn diagram, Carroll diagram). Afterwards, students should be provided with a variety of opportunities to choose the type of representation that is appropriate for what they want to demonstrate.
Personal Representations
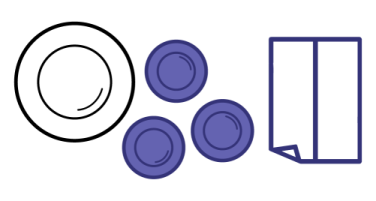
From kindergarten to Grade 2, the use of concrete materials (for example, containers, plates, large cardboards divided into sections) facilitates the representation of sorting and classifying objects.
The skills developed in sorting and classifying concrete objects will be useful in developing categories for grouping survey data and creating a graph to represent the data. It is important to note, however, that classifying data requires a higher level of abstraction from students than classifying concrete objects. Educators can help students develop this level of abstraction by first suggesting that they represent the classification of responses to a survey question using representative materials. For example, students could represent the responses to the question 'Do you have a cat? by placing stickers in the appropriate column of a simple table. Note that this type of table also introduces students to classifying using a Carroll diagram.
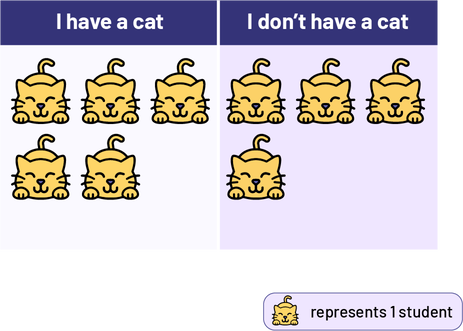
Image Simple table with two columns: “I have a cat” and “I don't have a cat”. The first column has five cats and thesecond column has four cats. Legend: one cat represents one student.
Source: translated from Guide d’enseignement efficace des mathématiques, de la maternelle à la 3e année, Traitement des données et probabilité, p. 45-47.
Knowledge: Attribute
An attribute of an object corresponds to one of its observable properties (for example, colour, shape, size).
The concept of attribute is very important as it is found and used in all areas of mathematics. When sorting and classifying, the attribute of an object becomes the criterion for classification and the characteristics of the attribute define the classes or categories. In order to classify, students must:
- observe several attributes of the object (for example colour, material, size);
- choose an attribute for the classification;
- note some characteristics of this attribute (for example, if the attribute is material, the characteristics can be wood, plastic, paper).
Determining the characteristics of an attribute is usually easier than defining the attribute itself, because defining an attribute requires synthesis. For example, if students observe that buttons are smooth, rough, or wavy, they will use these characteristics to define the three classes into which the buttons will be grouped. Upon analysis, students will be able to recognize that these are three characteristics of the texture attribute. In some cases, it is best for educators to suggest the choice of an attribute initially.
Note: Attributes are used to sort and categorize data, and categories are used to create tables and graphs.
Through the activities, students become aware that the description of a set must be accurate so that it can be determined with certainty whether or not an object belongs in the category. For example, they realize that categories such as 'fat, not fat' or 'funny, not funny' are subjective and can vary depending upon the person making the classification.
Some object descriptions are based on comparison. When the attribute corresponds to a measurement (for example length), the characteristics can be defined using a comparison (for example objects longer than a chalk).
The table below shows some examples of attributes and characteristics that students could use to classify a collection of buttons.
| Attributes | Characteristics |
|---|---|
| texture | smooth, rough or wavy |
| number of holes | 0, 2, 3 or 4 |
| size | small or big, long or short |
| thickness | thin or thick |
| shape | round or not round |
| colour | red, blue, or black; brown or not brown |
Source: translated from Guide d’enseignement efficace des mathématiques, de la maternelle à la 3e année, Traitement des données et probabilité, p. 38-39.
Knowledge: Characteristics
A characteristic describes how the attribute is reflected in a particular object (for example, if the attribute is colour, the characteristics might be red, blue, yellow).
Source: translated from Guide d’enseignement efficace des mathématiques, de la maternelle à la 3e année, Traitement des données et probabilité, p. 38.
Knowledge: Venn Diagram
The Venn diagram shows the differences and intersection of elements of different sets.
The Venn diagram includes the following components:
- a title that designates the reference set;
- an outside rectangle that contains all the objects to be classified;
- one or more circles in which objects with the same characteristic are grouped (the number of circles depends on the number of categories needed to classify the objects);
- a label that defines each characteristic.
The appearance of the Venn diagram may vary depending on the categories it represents. Diagram A below shows the classification of objects into a single category, 'children'. This type of diagram can be created through concrete materials in kindergarten. For example, children's names or pictures can be grouped together in a closed line, or children can be asked to stand inside a circle on the floor. In a Venn diagram, any object that is part of the reference set can be located in one of the regions of the diagram, even objects that do not have one of the selected characteristics. For example, in diagram A, Mr. Paul is not an element of the set 'the children', but he is part of the reference set 'the people in the kindergarten class'. This name is then placed in the region inside the rectangle, but outside the circle.
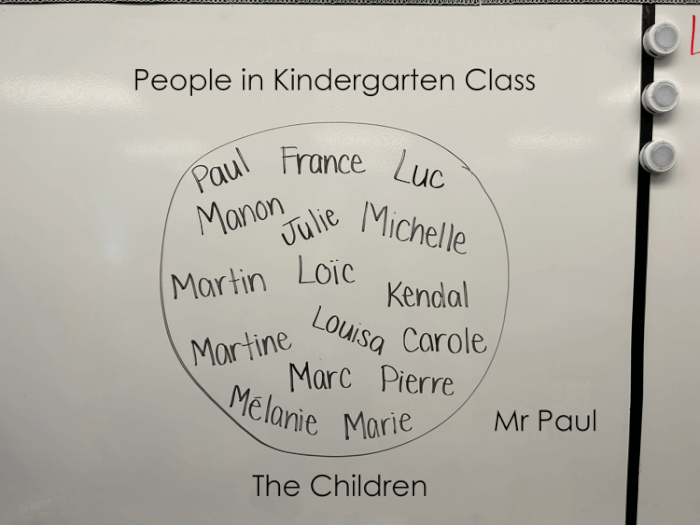 Image Venn diagram A, made up of a single category, The children, with the title People in the kindergarten class.The circle contains the first names of the children in the class group, and the teacher's name is outside the circle.
Diagram A
Diagram B below represents the classification of objects into four distinct categories. In this case, it is the classification of foods into four groups. This type of Venn diagram can be created using concrete materials, drawings or illustrations as early as Grade 1.
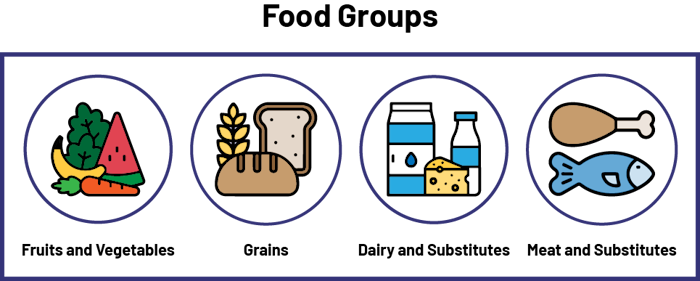
Diagram B
Diagram C below represents the classification of objects into two categories that are not distinct. When an object can be classified into either category, it is found in the region where the two circles intersect. This type of diagram is the best known representation of the Venn diagram and can be introduced as early as Grade 2.
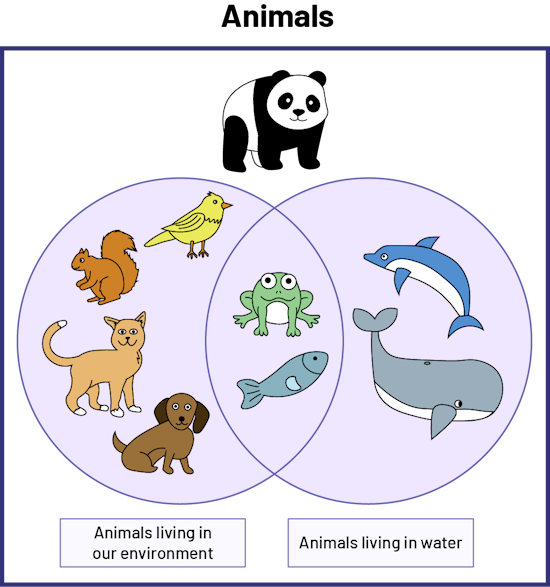 ImageVenn diagram C, titled Animals, formed by two circles: Animals living in our environment and Animals living in water.The first contains a dog, a cat, a squirrel and a bird, the second contains a whale and a dolphin, and the shared areacontains a fish and a frog.
Diagram C
In this diagram, we note, for example, that:
- the dog is a part of the set 'Animals that live in our environment';
- the frog is both a part of the set 'Animals that live in our environment' and the set 'Animals that live in water';
- the panda is not part of the 'Animals that live in our environment' and 'Animals that live in water' sets, but it is a part of the 'Animals' reference set.
Source: translated from Guide d’enseignement efficace des mathématiques, de la maternelle à la 3e année, Traitement des données et probabilité, p. 48-51.
Knowledge: Carroll Diagram
The Carroll diagram highlights a part of the reference set and its complement.
The Carroll diagram includes the following components:
- a title that designates the reference set;
- a rectangle divided into regions representing subsets of the reference set;
- labels to designate the subsets.
Diagram A below represents the classification of shoes according to a single attribute, laces. The two characteristics defined for this attribute are 'with laces' and 'without laces'. Note that these two characteristics are complementary, in other words all shoes have one or the other characteristic, but not both.
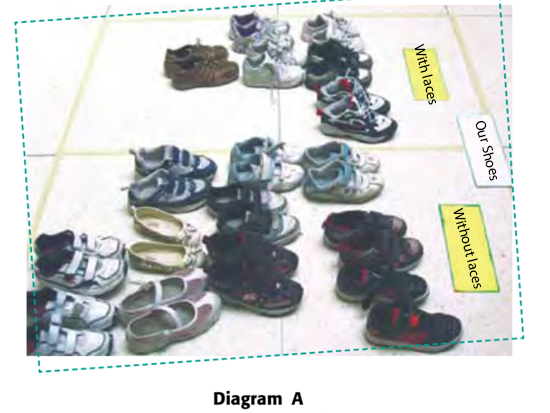
Diagram B below represents the classification of numbered tokens according to colour (red or green) and whether they are odd or even (parity).
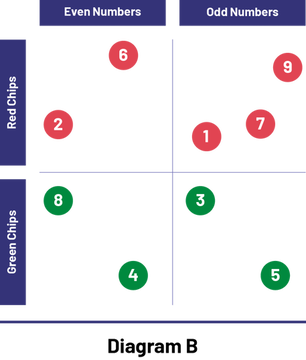
Image Diagram B composed of two rows and two columns. First column: Even numbers First row : Red chips This first box contains two red chips, one numbered 6, and the other is numbered 2. Second column: Odd numbers First row: Red Chips This second box contains three red chips, the first numbered 1, the second, 7, and the third, 9. First column: Even numbers Second row: Green Chips This third box contains two green chips, one numbered 8 and the other, 4. Second column: Odd numbers Second row: Green Chips This third box contains two green chips, one numbered 3 and the other, 5.
Diagram C below represents the classification of attribute blocks according to colour (blue or not blue) and shape (triangle or not a triangle).
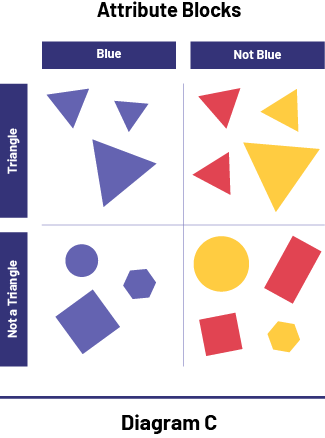
Image Diagram C, titled Logic blocs, is composed of two rows and two columns. First column: Blue First row: Triangle This box contains three blue triangles. Second column: Non-blue First row : Triangle This box contains two red triangles and two yellow triangles. First column: Blue Second row: Not a triangle This square contains a blue disk, a blue square and a blue hexagon. Second column: Non-blue Second row: Not a triangle This contains a yellow disk, a yellow hexagon, a red square and a red rectangle.
Source: translated from Guide d’enseignement efficace des mathématiques, de la maternelle à la 3e année, Traitement des données et probabilité, p. 52-53.