D2.2 Make and test predictions about the likelihood that the mode(s) of a data set from one population will be the same for data collected from a different population.
Activity 1: Making Predictions
Show the bar graph below to the students.
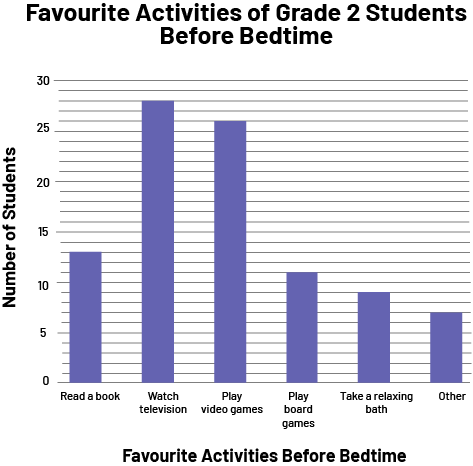 Image Vertical bar graph titled Favourite Activities of Grade 2 Students Before Bedtime. The vertical axis, Number of Students, is numbered from 0 to 30 in increments of five. The horizontal axis, Favourite Activities Before Bedtime, is composed of six categories: Read a book, with 13 students, Watch television, with 28 students, Play video games, with 26 students, Play board games, with 11 students, Taking a relaxing bath, with 9 students, and Other, with 7 students.
Ask students to make predictions about the likelihood that the mode of this data set would remain the same if the data were collected from Grade 6 classrooms.
Activity 2: Check Predictions
The mayor of the municipality of Linfort wishes to invest a significant amount of money for the youth of his community. After several meetings with various organizations in the region, five choices were found to be interesting: the construction of a movie theatre, an arcade, a recreation centre, a wave pool or a miniature golf course. In order to make a wise choice, the mayor surveyed students in Grades 2 and 6 at the local school.
The following are the results of the data collected from the Grade 2 students.
 Image Vertical bar graph titled Favourite Project Among Grade 2 Moulin School Students. The vertical axis, Number of Students, is numbered from 0 to 35 in increments of five. The horizontal axis, Proposed Projects, is composed of five categories: Movie theatre, with 26 students; Arcade, with 8 students; Rec Centre, with 31 students; Wave Pool, with 25 students; and Minigolf, with 12 students.
Ask students questions such as:
- What is the mode among Grade 2 students? How do you know?
- Do you think the data collected will be different for students in Grade 6? Why?
- What do you think the probability is that the mode is the same for both populations? Why?
Now present the data collected from the Grade 6 students.
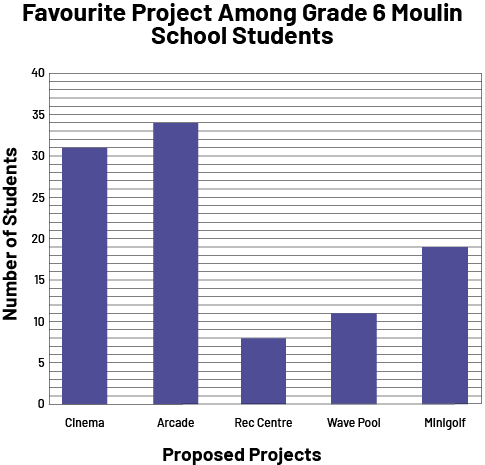 Image Vertical bar graph titled Favourite Project Among Grade 6 Moulin School Students. The vertical axis, Number of Students, is numbered from 0 to 40 in increments of five. The horizontal axis, Proposed Projects, is composed of five categories: Movie theatre, with 31 students; Arcade, with 34 students; Rec Centre, with 8 students; Wave Pool, with 11 students; and Minigolf, with 12 students.
Ask students to check their predictions by comparing the data collected from Grade 2 students with the data collected from Grade 6 students.
Ask them the following questions:
- How does the data from the two populations differ? Are they similar? Justify each answer.
- Is the mode of the two populations the same? How do you know?
- Why does the mode differ from one population to another?
- Does population size play an important role when comparing the mode of two different populations? Why?