D1.1 Sort sets of data about people or things according to two and three attributes, using tables and logic graphs, including Venn, Carroll, and tree diagrams, as appropriate.
Skill: Sorting Sets of Data
Sorting involves grouping objects that have a common characteristic (for example, objects that are large) and discarding those that do not (for example, objects that are not large).
Source: translated from Guide d’enseignement efficace des mathématiques, de la maternelle à la 3e année, Traitement des données et probabilité, p. 36.
Skill: Classifying Sets of Data
Classifying involves the identification of a common attribute among all items within a group (for example, size). Items are then categorized according to different characteristics of that attribute (for example, large, medium, small).
Source: translated from Guide d’enseignement efficace des mathématiques, de la maternelle à la 3e année, Traitement des données et probabilité, p. 36.
Knowledge: Attribute
An attribute of an object corresponds to one of its observable properties (for example, colour, shape, size).
The concept of attribute is very important as it is found and used in all areas of mathematics. When sorting and classifying, the attribute of an object becomes the criterion for classification and the characteristics of the attribute define the classes or categories. In order to classify, students must:
- observe several attributes of the object (for example colour, material, size);
- choose an attribute for the classification;
- identify some characteristics of this attribute (for example, if the attribute is material, the characteristics can be wood, plastic, paper).
Determining the characteristics of an attribute is usually easier than defining the attribute itself, because defining an attribute requires effort to synthesize. For example, if students observe that buttons are smooth, rough, or wavy, they will use these characteristics to define the three classes into which they will group the buttons. Upon analysis, they will be able to recognize that these are three characteristics of the texture attribute. In some cases, it is best for educators to propose the choice of an attribute at the outset.
Note: attributes are used to sort and categorize data, and categories are used to create tables and graphs.
Through the activities, students become aware that the description of a set must be accurate so that it can be determined with certainty whether or not an object belongs in the category. For example, they realize that categories such as "large, not large" or "funny, not funny" are subject to the subjectivity of the person making the classification.
Some object descriptions are based on comparison. When the attribute corresponds to a measurement (for example length), the characteristics can be defined using a comparison (for example objects longer than a chalk).
Source: translated from Guide d’enseignement efficace des mathématiques, de la maternelle à la 3e année, Traitement des données et probabilité, p. 38-39.
Knowledge: Characteristic
An attribute characteristic describes how the attribute is reflected in a particular object (for example, if the attribute is colour, the characteristics might be red, blue, yellow).
Source: translated from Guide d’enseignement efficace des mathématiques, de la maternelle à la 3e année, Traitement des données et probabilité, p. 38.
Knowledge: Venn Diagram
The Venn diagram shows the differences and intersection of elements of different sets.
The Venn diagram includes the following components:
- a title that designates the reference set;
- an outside rectangle that contains all the objects to be classified;
- one or more circles in which objects with the same characteristic are grouped (the number of circles depends on the number of categories needed to classify the objects);
- a label that defines each set.
The appearance of the Venn diagram can vary depending on the nature of the categories it represents. The following diagram A presents the classification of objects according to a single category, namely “children”. This type of diagram can be constructed using concrete materials from kindergarten. For example, the children's names or photos can be grouped together in a closed line, or the children can be asked to stand inside a circle drawn on the floor. In a Venn diagram, any object which is part of the reference set can be located in one of the regions of the diagram, even the objects which do not present one of the retained characteristics. For example, in diagram A, Mr. Paul is not an element of the set “the children”, but he is part of the reference set “People in the kindergarten class”. This name is then placed in the region inside the rectangle, but outside the circle.
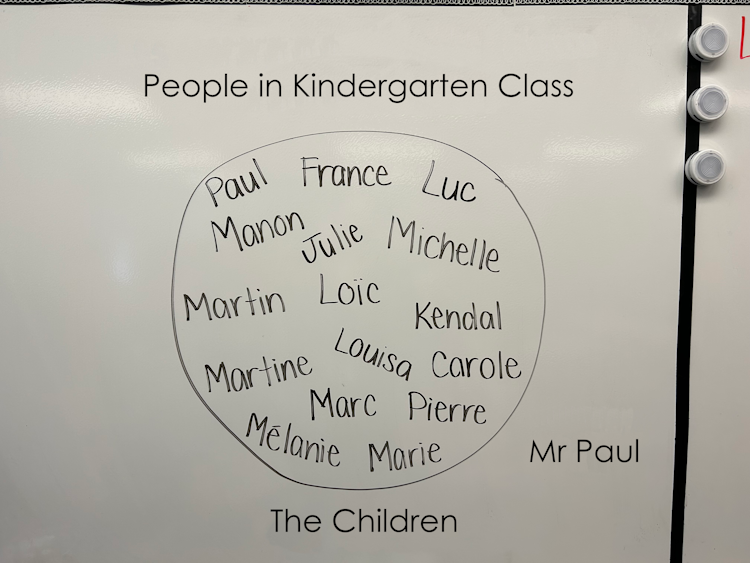 Image On a whiteboard, a set of first names is circled in felt-tip pen. Above the set, it is written, "Peeople in the Kindergarten Class." Below the set, it is written, "The Children." To the right of the set, it says: "Mr. Paul".
Diagram A
The following B diagram represents the classification of objects into four distinct categories. In this case, it is the classification of foods into four groups. This type of Venn diagram can be constructed using concrete materials, drawings or illustrations as early as Grade 1.
 Image Diagram B is an illustration titled "Food Groups" that presents 4 images associated with their respective group. The Fruit and vegetables group is represented by a slice of watermelon, a leaf of lettuce, a banana and a carrot. The Grain group is represented by two loaves of bread and a wheat stalk. The Dairy and substitutes group is represented by a pint of milk, a yogurt drink and a cheese. The Meat and substitutes group is represented by a fish and a chicken drumstick.
The following C diagram represents the classification of objects into two categories that are not distinct. When an object can be classified into either category, it is found in the region corresponding to the intersection of the two circles. This type of diagram is the best-known representation of the Venn diagram and can be introduced as early as Grade 2.
 Image Diagram C is titled: Animals. A panda is shown above a two-circle Venn diagram. The set on the left is labeled: "Animals living in our environment." It contains a bird, a squirrel, a cat and a dog. It also has a frog and a fish in its shared part with the next set. The next set is called "Animals living in water". In addition to the frog and fish that are shared with the other set, this set contains a dolphin and a whale.
In this diagram, we note, for example, that:
- the dog is a part of the set "Animals that live in our environment";
- the frog is both a part of the set "Animals that live in our environment" and the set "Animals that live in water";
- the panda is not part of the "Animals that live in our environment" and "Animals that live in water" sets, but it is a part of the "Animals" reference set.
Source: translated from Guide d’enseignement efficace des mathématiques, de la maternelle à la 3e année, Traitement des données et probabilité, p. 48-51.
Knowledge: Carroll Diagram
The Carroll diagram highlights a part of the reference set and its complement.
The Carroll diagram includes the following components:
- a title that designates the reference set;
- a rectangle divided into regions representing subsets of the reference set;
- labels to designate the subsets.
Diagram A below represents the classification of shoes according to a single attribute, laces. The two characteristics retained for this attribute are "with laces" and "without laces". Note that these two characteristics are complementary, in other words all shoes have one or the other characteristic, but not both.
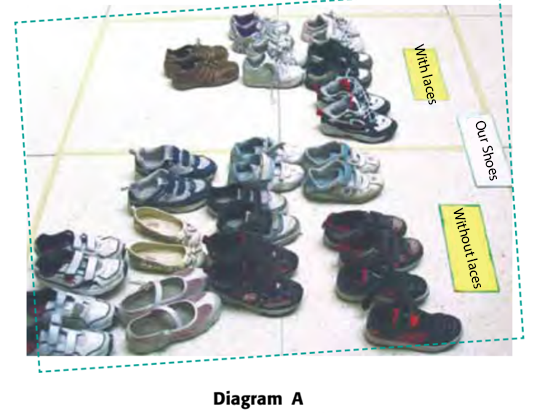 Image Diagram A is a Caroll diagram made with real objects. It is titled "Our Shoes". The set on the left is called "With Laces" and shows 6 pairs of shoes that tie with laces. The set on the right is called "Without laces" and shows 11 pairs of shoes that are tied with velcro, eyelets, or without ties.
The following diagram B represents the classification of numbered chips according to colour (red or green) and parity (even or odd).
 Image Diagram B shows four quadrants. The top left quadrant, "Even Numbers" and "Red Chips," contains chips 2 and 6, which are red. The top right quadrant, "Odd Numbers" and "Red Chips", contains chips one, 7 and 9, which are red. The bottom left quadrant, "Even Numbers" and "Green Chips", contains chips 4 and 8, which are green. And the bottom right quadrant, "Odd Numbers" and "Green Chips", contains chips 3 and 5, which are green.
Diagram C below represents the classification of attribute blocks according to colour (blue or not blue) and shape (triangle or not a triangle).
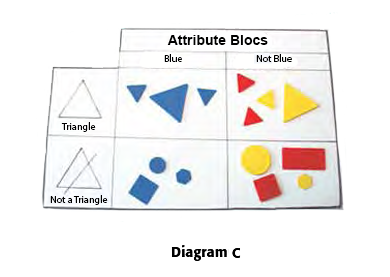 Image Diagram C shows 4 quadrants. The top left quadrant, "Blue" and "Triangle" contains 3 blue triangles of different sizes. The top right quadrant, "Non-blue" and "Triangle", contains 2 yellow triangles and 2 red triangles. The bottom left quadrant, "Blue" and "Non-triangle" contains a blue square, circle and hexagon. And the bottom right quadrant, "Non-blue" and "Not a triangle" contains a yellow circle and hexagon, and a red square and rectangle.
Source: translated from Guide d’enseignement efficace des mathématiques, de la maternelle à la 3e année, Traitement des données et probabilité, p. 52-53.
Knowledge: Tree Diagram
A tree diagram can be used to identify all possible category combinations for attributes associated with a data set.
The number of possible combinations can be determined by multiplying the number of categories of an attribute by the number of categories of the other attributes. As an example, consider the following attributes: "shape" (circle, rectangle, triangle, hexagon), "colour" (red, blue, green) and "size" (large, not large). In this example, the result of the multiplication 4 × 3 × 2 gives the number of possible combinations.
Example
Three-Attribute Tree Diagram
- Students in School B were asked a question, whether they want an envelope for their card. The tree diagram below shows the students' responses based on their selection of markers or crayons.
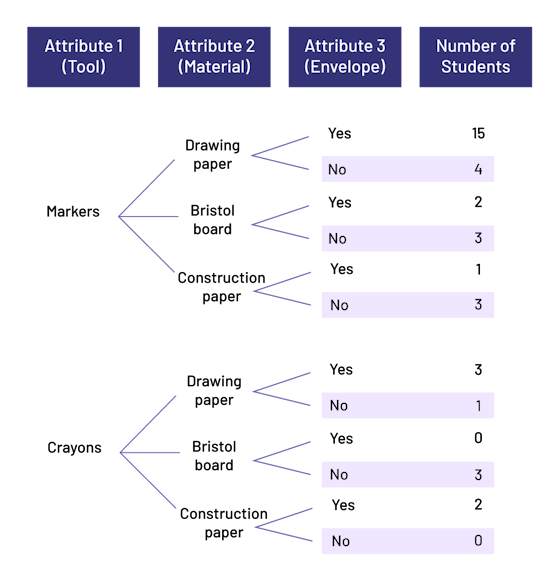 Image Attribute one, the tool, has two options: markers or crayons. Attribute two, the material, has three options: drawing paper, bristol board or construction paper. Attribute three, the envelope, has two options: yes or no. And the number of students varies from zero to 15. When the marker tool is linked to drawing paper and yes, the number of students is 15. When the marker tool is linked to drawing paper and no, the number of students is 4. When the marker tool is linked to bristol board and yes, the number of students is two. When the marker tool is linked to bristol board and no, the number of students is 3. When the marker tool is linked to construction paper and yes, the number of students is one. When the marker tool is linked to construction paper and no, the number of students is three. When the crayons tool is linked to drawing paper and yes, the number of students is 3. When the crayons tool is linked to drawing paper and no, the number of students is one. When the crayons tool is linked to bristol board and yes, the number of students is zero. When the crayons tool is linked to bristol board and no, the number of students is three. When the crayons tool is linked to construction paper and yes, the number of students is 2. And when the crayons tool is linked to construction paper and no, the number of students is zero.
Source: The Ontario Curriculum. Mathematics, Grades 1-8 Ontario Ministry of Education, 2020.