D1.4 Determine the mean and identify the mode(s), if any, for various data sets involving whole numbers, and explain what each of these measures indicates about the data.
Skill: Explaining What the Mean and the Mode(s) Indicate About Data
Statistical measures are values used to describe a set of data. For example, the mean is a statistical measure. Statistical measures are used in the fourth step of the inquiry process, which is interpreting the results. They are another way of giving meaning to the data and can provide information to take into consideration when making a decision.
Various statistical measures are commonly used in data analysis.
Source: translated from Guide d’enseignement efficace des mathématiques, de la 4e à la 6e année, Traitement des données et probabilité, p. 107.
Knowledge: Mode
The mode of a set of data represents the data with the highest frequency, in other words, the data that appears most often. The mode is particularly meaningful in inquiry contexts where we are trying to determine what is most popular, most sold, most frequent, etc. As the following examples illustrate, it is possible to determine the mode of a quantitative or qualitative set of data.
Example 1
The table below shows the data corresponding to the number of children in the families of the students in the class. It can be seen that the most frequent response is 2, which indicates that there are more families with 2 children. Therefore, the mode of this quantitative set of data is 2 children per family.
Number of Children in the Families of the Students in the Class
| Number of Children in the Family | Number of Students |
|---|---|
| 1 | 3 |
| 2 | 12 |
| 3 | 6 |
| 4 | 3 |
| more than 4 | 2 |
Example 2
The following graph looks at the preferred colours of the students in the class. To determine the mode of this qualitative data, we need only investigate the length of the bars. We see that the red and blue bars are equal in length and are longer than all the others. In this case, there are two modes, red and blue.
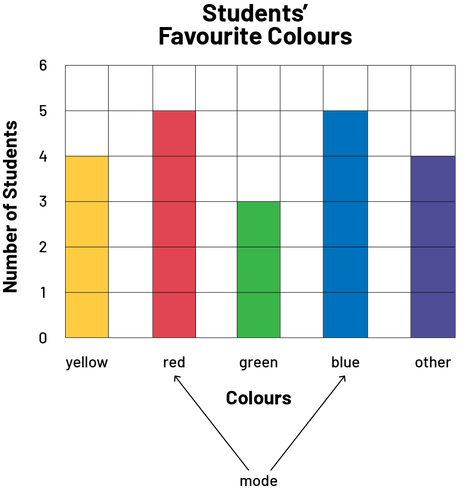 Image The colored 5-bar graph is titled: "Students’ Favorite Colours". The horizontal axis is called "Colours", while the vertical axis is called "Number of Students". The yellow bar goes up to the number 4. The red bar goes up to number 5. The green bar goes up to the number 3. The blue bar rises to the number 5, and the purple bar meaning "Other" rises to the number 4. With arrows, the word "mode" points to the red bar and the blue bar.
When using the mode to answer a question of interest or to make a decision, it is important to consider the entire set of data. In some situations, the most frequent data item may not necessarily make the best sense of the data. It is important to encourage students to examine each situation closely before making conclusions based on the mode. For example:
- In the previous example 1, the mode of 2 children per family seems to be fairly representative of the situation since there is a significant difference between this frequency and the others.
- In the previous example 2, not only are there two modes (red and blue), but the difference between their frequency and the other frequencies is not very large, so it is difficult to conclude that these two modes represent a strong colour preference. In this case, it would be better to mention that red and blue are slightly more popular, but that yellow follows closely behind.
- For the line plot below, the mode corresponds to 60 heartbeats per minute. We can see that this number is far from the range that accounts for most of the data (69 to 77). Also, we can see that the overall range is large (29) and that the data appear only once, twice, or three times each. Therefore, it would be best not to use the mode to make a conclusion about this set of data.
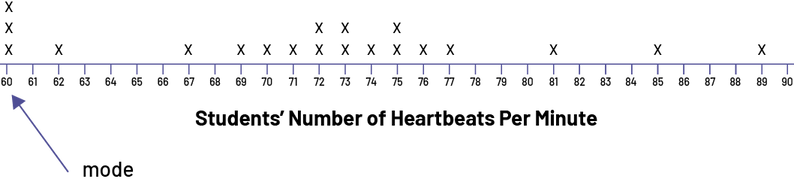 Image The counting line is titled "Students’ Number of Heartbeats Per Minute". It is graduated from 60 to 90. With an arrow, the word "mode" points to the number 60. The numbers that have no X's are: 61, 63, 64, 65, 66, 68, 78, 79, 80, 82, 83, 84, 86, 87, 88, and 90. The numbers 62, 67, 69, 70, 71, 74, 76, 77, 81, 85 and 89 have an X. The numbers 72, 73 and 64 have two X's. The number 60 has three X's.
Source: translated from Guide d’enseignement efficace des mathématiques, de la 4e à la 6e année, Traitement des données et probabilité, p. 108-111.
Knowledge: Mean
According to the curriculum, the concept of mean is studied for the first time in Grade 3. However, most students have probably seen or heard the word average in the media and in their reading (for example, average temperature, average age, average cycle). It is important to emphasize that in everyday language, the word average can have a general, undefined meaning. For example, if we say that on average, a student should do 10 sit-ups in 30 seconds, we are implying that this is the number of sit-ups that most students should be able to do, but that some students may do more and others may do less.
In mathematics, the average has a more precise meaning; it is the value resulting from an equal distribution. For example, if 5 friends have collected $5, $7, $7, $8 and $8 respectively, and they pool these amounts to share them equally, each will receive $7. The mean of the amounts collected is therefore equal to $7. The mean the students are working with is also referred to as the arithmetic mean and is often referred to as the average. Teachers should focus on supporting students to understand the concept of the mean rather than memorizing the usual algorithm (the sum of the data divided by the number of data). To do this, teachers should provide students with activities that use the equal share model. Otherwise, students gain only a limited understanding of the concept of mean.
Equal Share
The following examples demonstrate different situations that use the equal share model and help develop a good understanding of the concept of a mean. The equal share model can be used to determine a mean without having to use the usual algorithm.
Example 1
Amir, Bruno, Carla, Denis and Elmira went fishing and caught 2, 2, 3, 3 and 10 fish respectively. Determine the mean for the number of fish caught.
To determine the mean for the number of fish caught, students can determine how many fish each would have if the fish were equally distributed. They can first illustrate the initial situation as follows.
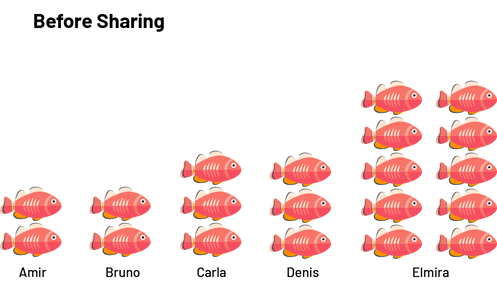
Then, they proceed to the sharing: Elmira gives 2 fish to Amir, 2 fish to Bruno, 1 fish to Carla and 1 fish to Denis.

After sharing, each has 4 fish. So we can conclude that on average, the 5 friends caught 4 fish each.

In order to deepen the concept of mean, it is important to give students the opportunity to reverse the process by asking them to create a set of data with a given mean. This reinforces the concept of mean as the result of equal sharing.
Example 2
Six students in a class determined that they had, on average, 5 pens each. What might be a possible distribution of pens among these six students?
Since the 6 students average 5 pens each, each student would have 5 pens after the equal share.
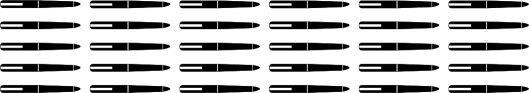
This gives a total of 30 pens (6 x 5). The 6 students can then divide the 30 pens among themselves as they see fit. Regardless of the division chosen, the average of 5 pens per student will be maintained. Here is an example of a possible division:
 Image Six columns of pens are lined up side by side. The first column has 5 pens, the second column has 7 pens, the third column has 4 pens, the fourth column has three pens, the fifth column has 7 pens and the sixth column has 4 pens.
We can verify that there are still a total of 30 pens.
One can use the equal sharing model to develop an understanding of the usual algorithm as illustrated in the following example. The model will provide a solid foundation for the standard algorithm for the mean, as it demonstrates the idea of pooling the amounts of money and then sharing it among the friends (sum of the data set divided by the number of values in the data set).
Example 3
Annie, Baeya, Carl, Daniel and Eva have $5, $6, $8 and $10 respectively. How much money does each have on average?
First, the money is pooled to find that there is $35 in total, which is equal to $5 + $6 + $6 + $8 + $10 = $35. The money is then divided equally and each person receives $7, which is equal to $35 ÷ 5 = $7.
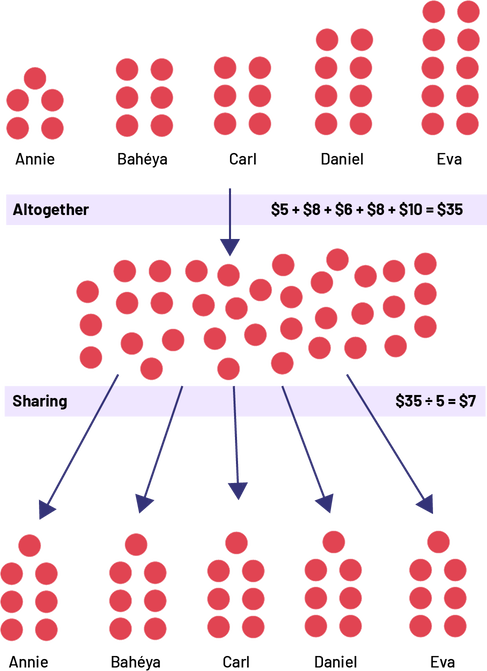 Image At the top of Example 3, five student names each have a few red chips. Annie has 5 chips, Bahéya has 6 chips, Carl has 6 chips, Daniel has 8 chips and Eva has 10 chips. Under the names it says: Altogether, 5 dollars plus 6 dollars plus 6 dollars plus 8 dollars plus 10 dollars equals 35 dollars. An arrow points to the middle of Example 3 where all the chips are pooled for a total of 35. Below the pile of 35 chips, it says: Sharing, 35 divided by 5 equals 7 dollars. Under the cluster of 35 chips, 5 arrows point down to each of the names that are repeated and where the chips are redistributed equally. Annie, Bahéya, Carl, Daniel and Eva each have 7 chips.
Teachers can use this example to emphasize to students that the mean of a set of data is not necessarily a number that is part of that set. For some students, this idea is difficult to understand.
Source: translated from Guide d’enseignement efficace des mathématiques, de la 4e à la 6e année, Traitement des données et probabilité, p. 115-119.