D1.1 Sort sets of data about people or things according to two and three attributes, using tables and logic graphs, including Venn, Carroll, and tree diagrams, as appropriate.
Activity 1: Attribute Search
Observation Points During an Attribute Search Activity
Observe if students:
- explain the differences between the objects;
- note the details;
- compare the characteristics;
- create classes;
- examine objects that are not part of a class to determine the characteristics of the class;
- define the attribute;
- consider more than one attribute at a time;
- sort and classify the same objects according to several attributes.
Source: translated from Guide d’enseignement efficace des mathématiques, de la maternelle à la 3e année, Traitement des données et probabilité, p. 42.
Classroom Intervention Ideas
To prompt students to classify the same 2 dimensional shapes by another attribute or by two attributes using the conjunction and (for example, size and colour), ask questions such as:
- Can we group these shapes in another way?
- If I remove these shapes, how could we classify the remaining ones? Why?
- If these two shapes were placed in the same category, what would we name this new category?
Source: translated from Guide d’enseignement efficace des mathématiques, de la maternelle à la 3e année, Traitement des données et probabilité, p. 45.
Activity 2: Venn Diagram
Teachers can also introduce students to classifying using a Venn diagram. For example, they ask them to indicate whether they like:
- pasta;
- vegetables;
- pasta and vegetables;
- neither pasta nor vegetables.
Teachers place two hoops as in the picture below and add a label under each (vegetables, pasta) and ask students to represent their response by placing their name (or picture) in the appropriate place inside or outside the hoops.
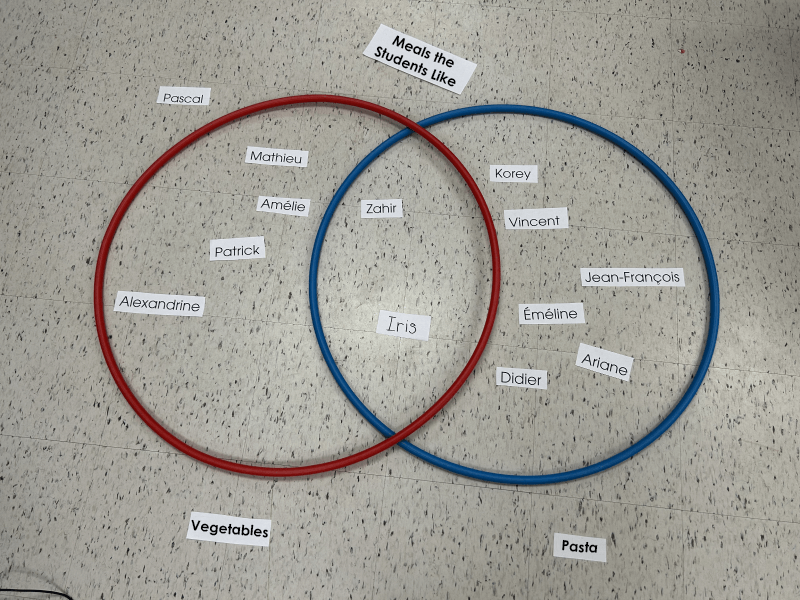 Image On a table, a blue hoop and a yellow hoop overlap to form a Venn diagram. Above the hoops, it says "Meals the students like". Below the blue hoop it says "Vegetables". Inside the blue hoop are the following first names: Matthew, Alexandria, Amélie and Patrick. Below the yellow hoop, it says "Pasta". Inside the yellow hoop are the following names: Kerry, Vincent, Ernestre, Jean-Lévis, Didier and Ariane. In the part where the hoops join, there are the names Zefir and Ines. Outside the two hoops, there is the name Pascal.
Thus, from this representation, we see that:
- 8 students like pasta;
- 6 students like vegetables;
- 2 students like pasta and vegetables (Zahir and Ines);
- 1 student does not like pasta nor vegetables (Pascal).
Source: translated from Guide d’enseignement efficace des mathématiques, de la maternelle à la 3e année, Traitement des données et probabilité, p. 47-48.
To help students understand the concept of intersection of two sets, teachers can:
- prepare a number of objects to be classified according to two different characteristics;
- make sure that some of the objects have both characteristics and others do not;
- draw a rectangle with wool or lay a tablecloth or tarp on the floor to represent the reference set;
- place all the objects to be classified in a corner of the rectangle;
- place two different colored hoops side by side and identify them according to the chosen characteristics;
- have students place objects in the appropriate hoops until they come across an object that can be placed in both;
- then ask questions such as: "Where do we place the object? Do you have any suggestions?";
- use students' responses to prompt them to arrange the hoops so that one overlaps a section of the other, as in the previous diagram;
- place the object in the region corresponding to the intersection of the two hoops and ask students to describe the objects that should be placed in that region;
- continue the activity until all the objects have been classified and ask students to justify their classification;
- ask students to explain why certain objects must be placed outside the hoops.
Source: translated from Guide d’enseignement efficace des mathématiques, de la maternelle à la 3e année, Traitement des données et probabilité, p. 51.
Activity 3: Reorganize Information
Present the following scenario to the students.
Grade 3 students at Laviolette School were asked to express their preference for extracurricular activities at the school. Each teacher recorded the data for their class in their own way. Here are the charts they submitted.
Distribute a copy of Appendix 4.8 (Laviolette School Survey) to each student and invite them to reorganize the data into one or more charts of their choice. Encourage students to interpret the results and make relevant observations. Facilitate a class discussion to deepen interpretation by asking questions such as:
- What does the data tell you?
- Are the data for each class similar?
- What would be the results of the survey for all three grades?
- Are there activities that were chosen by the same number of students in all three classes?
- How many more of the three classes prefer ball games to improvisation?
- Did at least half of the students in the three classes prefer another activity to ball games?
- Are there more students in the three classes who prefer chess and science experiments to improvisation?
- In descending order, what are the favourite activities of the students in the three Grade 3 classes at Laviolette School?
Have students develop a similar survey in the school and compare the results with those of Laviolette School.
Source: translated from Guide d’enseignement efficace des mathématiques, de la 4e à la 6e année, Traitement des données et probabilité, p. 195-196.