D1.4 Determine the mean and identify the mode(s), if any, for various data sets involving whole numbers, and explain what each of these measures indicates about the data.
Activity 1: Determining the Mean
Astrid has been keeping track of the number of soccer practices she has had over the past 6 months and would like to determine the average number of practices she has participated in each month. Here is an unorganized list of the data collected:
14 11 10 9 9 13
Ask students to determine the mean number of soccer practices Astrid has each month using manipulatives (for example, blocks). Invite students to explain in their own words what the mean indicates about the data.
Activity 2: Determining the Mode
Mr. Lamontagne counted the number of points earned by each class in his school. Students can earn points for doing good deeds that reflect the school's values of empathy, pride and respect. Here is a graph that summarizes the data collected:
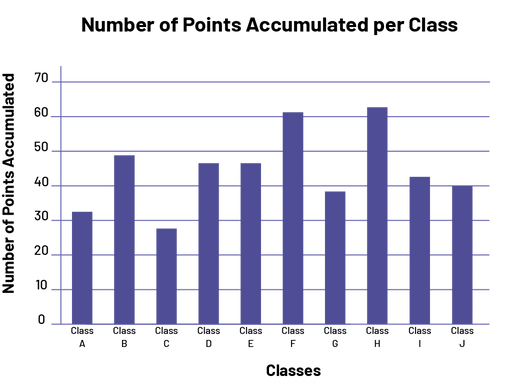 Image A purple ten bar graph is called "Number of Points Accumulated per Class". The horizontal axis is labeled "Classes", while the vertical axis is labeled "Number of Points Accumulated". At class A, the bar rises slightly above 30. At class B, the bar almost touches the number 50. At class C, the bar stops slightly below 30. At class D and class E, the bar stops between 40 and 50. At class F, the bar stops slightly above 60. At class G, the bar stops slightly below 40. At class H, the bar stops slightly above 60. At class I, the bar stops slightly above 40. And at class J, the bar stops right at 40.
Ask students to determine the mode of the data and explain in their own words what this value reveals about the data collected above.