D2.1 Use mathematical language, including the terms “impossible”, “unlikely”, “equally likely”, “likely”, and “certain”, to describe the likelihood of events happening, and use that likelihood to make predictions and informed decisions.
Activity 1: Clothing Arrangement (Possible Outcomes and Probability)
Summary
In this activity, students list all the possible outcomes of a probability situation and use them to describe the probability of particular outcomes.
Procedure
Present the following scenario to students.
Olivier has a red shirt and blue pants that he wants to wear every day to school. His mother would like him to wear his yellow and green shirts and gray pants as well. She tells him that from now on she will put his three shirts in an opaque bag and his two pairs of pants in another bag, and that every morning he must remove, without looking, one shirt from the shirt bag and one pair of pants from the pants bag. Every evening, the clothes worn during the day will be washed and put back in the bags so that the same clothes are available every day.
Ask students to identify all the possible shirt and pant combinations that Olivier could wear. If some students have difficulty identifying them, provide them with two bags with coloured tokens to represent the clothing. Then ask questions such as:
- Is it possible that Olivier chooses the red shirt and blue pants? Why?
- Is it possible that Olivier chooses the red shirt and blue pants every day of the week? Why?
- Would you say it is unlikely, likely or very likely that Oliver would choose the red shirt and blue pants every day of the week? Why?
- Is it possible that Olivier would choose a different combination than the red shirt and blue pants? Why?
- Would you say it is unlikely, likely or very likely that Olivier would choose a combination other than the red shirt and blue pants? Why?
- Olivier's mother decides to add a pair of beige pants to the bag of pants. Does this decision increase or decrease the likelihood that Olivier will choose his preferred arrangement? Justify your answer.
Source: translated from Guide d’enseignement efficace des mathématiques, de la maternelle à la 3e année, Traitement des données et probabilité, p. 270-271.
Activity 2: Yellow or Green?
Materials
- opaque bags containing 3 yellow and 7 green tokens (1 per team)
- yellow and green pencils (1 of each colour per team)
Summary
In this activity, students use the results of an experiment to estimate the number of yellow and green tokens in an opaque bag.
Procedure
Beforehand, prepare opaque bags containing 3 yellow and 7 green tokens. Group students in pairs and give each team a bag and tell them not to look in the bag. Tell them that the bag contains 10 tokens, some of which are yellow and some of which are green and that all of the bags have the same number of yellow and green tokens. Explain that the activity consists of trying to determine, without looking in the bag, how many of the tokens are yellow and how many are green. To do this, they can pick a token out of the bag 10 times to note its colour. However, they must put the token back in the bag after each attempt. Suggest that they record the results in a table of their choice.
When all teams have finished, ask a few teams to present their tables and say how many of each colour they think are in the bag.
Example
One team noted the following results:

Students then indicated that they think there are about 5 yellow and 5 green tokens in the bag.
Have students repeat the experiment two more times and use the results to again estimate the distribution of tokens of each colour. Then, have other teams present their tables and say how many tokens they think are in the bag of each colour. Ask questions such as:
- Is this second estimation the same as the first one you made or is it different? Why or why not?
- Since all bags contain the same number of yellow and green tokens, why didn't all teams make the same estimation? (Because estimations are based on chance outcomes.)
- What can we do to increase the probability that the estimation matches the exact distribution of tokens of each colour? (We could repeat the experiment a large number of times or we could pool the results of the 30 draws from each team.)
Ask each team to record the total number of yellow and green tokens from the 30 draws on a prepared table. Total up each colour and ask students to use this new information to formulate a third estimation of the distribution of tokens in the bag. Ask them to compare the number of tokens of each colour to the three estimations to determine which estimation best represents the correct distribution.
In general, the more trials, the better the estimation. However, due to the random nature of the draws, for some teams this may not be the case. This is an opportunity to discuss the concept of chance with students.
Source: translated from Guide d’enseignement efficace des mathématiques, de la maternelle à la 3e année, Traitement des données et probabilité, p. 271-273.
Activity 3: Probability of Events
Teachers present students with the spinner below and ask them to predict each of the following outcomes according to the probability attribute:
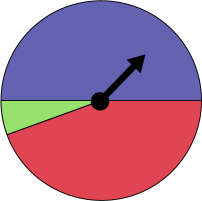 Image A pie chart with a needle shows one half in blue, and the other half almost entirely in red except for a small green section. The needle points into the blue section.
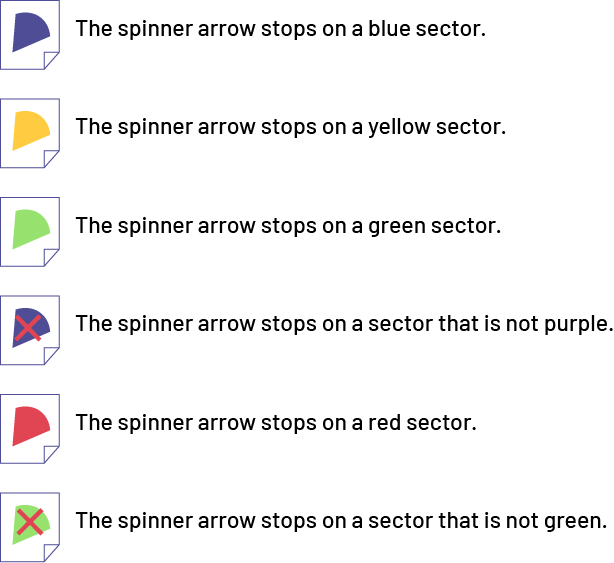
As illustrated below, students represent the predictions by placing the label corresponding to the outcome in an appropriate location on a probability line.
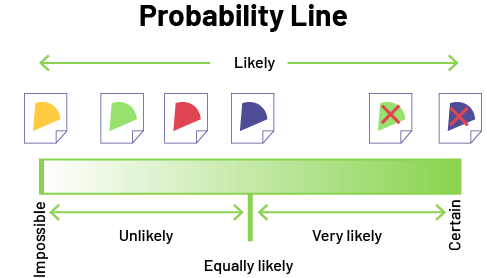 Image The illustration is titled: Probability Line. Below it, the word "likely" has a left-pointing arrow on its left, and a right-pointing arrow on its right. Below it, a progressive white bar gradually turns green. At the far left of the bar is the word "impossible", above which appears the yellow pie slice. Below the first half of the bar, it says "somewhat likely", with the green and red pie slices associated with it. In the middle of the bar is the word "equiprobable", with the blue pie slice associated with it. Below the second half of the bar, it says "very likely", with the green pie slice marked with a red X associated with it. And above the word "certain" on the far right of the bar is the purple pie slice with a red X.
It is important to note that in Kindergarten and Primary Divisions, students predict events or outcomes of a probability experiment based on their experiences and intuition, not on theoretical knowledge of the concept of probability. This intuitive prediction often depends on their understanding of the words used to name the features. For example, if teachers tell students that it is possible that recess will be extended by ten minutes, some students may interpret this to mean that it is certain that it will be. They do not understand that an event that is possible can happen as well as not happen.
Other students have difficulty distinguishing between the characteristics never and impossible. It is difficult for them to understand that while an impossible event is one that can never happen, an event that has never happened is not necessarily impossible. For example, it is impossible for the arrow in the previous example to land in a yellow sector, so even if you spin it 100 times, it will never land in a yellow sector. On the other hand, even if after 100 tries, the arrow has never landed in a green sector, this does not necessarily mean that this outcome is impossible.
Source: translated from Guide d’enseignement efficace des mathématiques, de la maternelle à la 3e année, Traitement des données et probabilité, p. 57-58.
Activity 4: Data Collection Related to Probability
In a probability experiment, a team spins a spinner 15 times and notes, with a check mark (√), every outcome in the appropriate place in a table.
_en.png) Three objects placed one below the other are respectively accompanied by check marks. A key is accompanied by 6 check marks. A paperclip has two check marks. And a pair of scissors is accompanied by 7 check marks. Next to this picture, there is a circle separated into three equal parts, each of which contains one of the objects. An arrow pointing to the right is placed under the key.
Three objects placed one below the other are respectively accompanied by check marks. A key is accompanied by 6 check marks. A paperclip has two check marks. And a pair of scissors is accompanied by 7 check marks. Next to this picture, there is a circle separated into three equal parts, each of which contains one of the objects. An arrow pointing to the right is placed under the key.
Source: translated from Guide d’enseignement efficace des mathématiques, de la maternelle à la 3e année, Traitement des données et probabilité, p. 72.
Activity 5: Data Analysis Related to Probability
The teacher presents the students with a bag and tells them that it contains a number of blue marbles (B), red marbles (R) and yellow marbles (Y). The teacher suggests that students conduct an investigation using a probability experiment to determine whether it is likely, unlikely or very likely that the bag contains the same number of marbles of each colour. The teacher groups the students and has each team conduct four draws, making sure to put back the marble in the bag after each draw. The teams then take turns recording their results on a prepared group chart. Once completed, the chart shows all the results obtained by the teams.
Source: translated from Guide d’enseignement efficace des mathématiques de la maternelle à la 3e année, Traitement des données et probabilité, p. 76.
The students realize that while this way of recording the data is effective, it does not give them a good overview of the results, so they decide to group them into a frequency table as follows.
Marbles Picked
| Team | 1st Draw | 2nd Draw | 3rd Draw | 4th Draw |
|---|---|---|---|---|
| 1 | B | B | R | Y |
| 2 | B | R | Y | B |
| 3 | B | Y | B | R |
| 4 | R | Y | B | B |
| 5 | B | B | B | Y |
| 6 | R | B | Y | B |
| 7 | Y | B | B | R |
| 8 | Y | B | R | B |
| 9 | Y | R | B | B |
| 10 | B | R | Y | R |
Results of Forty Drawings of a Marble
| Result | Count | Frequency |
|---|---|---|
| Blue marble |  |
19 |
| Yellow marble |  |
10 |
| Red marble |  |
11 |
Source: translated from Guide d’enseignement efficace des mathématiques, de la maternelle à la 3e année, Traitement des données et probabilité, p. 85.
Teachers encourage students to analyze the data presented in this table by asking questions at each of the three levels of comprehension. To get students to read the data, they ask questions such as:
- What is the title of the graph? (Results of Forty Draws of a Marble)
- How many times did we pick up a yellow marble? (Ten times)
- In how many categories were the results classified? (In three categories)
To get students to read between data, teachers ask questions such as:
- What was the most common result? (The "blue marble" result)
- What is the relationship between the frequency of this outcome and the frequency of each of the other two outcomes? (The frequency of the "blue marble" outcome is about twice the frequency of each of the other two outcomes. It is about the same as the frequencies of the "red marble" and "yellow marble" outcomes combined.)
To get students to read beyond the data, teachers ask questions such as:
- What conclusion can be drawn from these results? (There are probably more blue marbles than red or yellow marbles in the bag.)
- If you had to pick only one marble from the bag and you had to predict the outcome, what would you say? Why? (I would predict that it would be a blue marble because there seem to be more blue marbles in the bag than red or yellow, so I would have a better chance of predicting correctly.)
Note: A student might answer, for example, that the marble drawn will be red because it is his or her favourite colour. This type of answer is common among students whose probabilistic thinking is not yet well developed.
- If we did forty more draws, would we get the same results? (We wouldn't necessarily get the same results because they are random. However, we can expect that the "blue marble" result would still be the one with the highest frequency.)
After students analyze the data collected, teachers encourage them to interpret the results by asking questions such as:
- What did we want to know at the beginning of the inquiry? (We wanted to know if it is likely, unlikely or very likely that the bag contains the same number of marbles of each colour.)
- Did we get the answer to this question? (Yes. Based on the results of forty draws, it is unlikely that the bag contains the same number of marbles of each colour.)
- Can we be sure that this conclusion is correct? (We can't be sure because the results of the draws are random)
- What could we do to increase the probability that this conclusion is correct?(We could repeat the experiment and conduct, for example, 100 draws instead of 40)
Source: translated from Guide d’enseignement efficace des mathématiques, de la maternelle à la 3e année, Traitement des données et probabilité, p. 107-109.