D2.2 Make and test predictions about the likelihood that the mean and the mode(s) of a data set will be the same for data collected from different populations.
Activity 1: Make Predictions About the Probability of the Mean and the Mode Remaining the Same
Present the following scenario to the students.
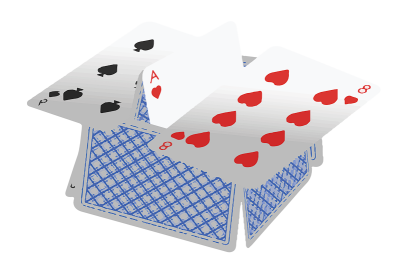
Students in Ms. Vadeboncoeur's class participated in a house of cards challenge: build the highest house of cards before it collapses. Here are the results recorded in a frequency table.

How Many Cards Did Our House of Cards Contain Before it Collapsed?
| Teams | Number of Cards |
|---|---|
| A | 24 |
| B | 26 |
| C | 30 |
| D | 40 |
| E | 30 |
Mrs. Vadeboncoeur's students enjoyed participating in the activity so much that they plan to repeat it the next day.
Ask students to determine the mode as well as the mean of their class scores and explain how this information can help them predict the scores for the next day.
Source: translated from En avant, les maths!, 3e année, CM, Données, p. 7-8.
Activity 2: Test Predictions with a Different Population
Present the following scenario to the students.
Grade 2 students at L'Étoile Filante School were surveyed by a local community organization to determine the mode and average number of minutes children spend playing outside each day at home. The following frequency table summarizes the data collected.
| Time Spent Playing Outside Each Day at Home | Frequency |
|---|---|
| 30 minutes | 19 |
| 1 hour | 26 |
| 1 hour 30 minutes | 17 |
| 2 hours | 8 |
| 2 hours 30 minutes | 0 |
| Other | 2 |
Ask students to determine the mode as well as the mean for the collected data. Have them make predictions about the likelihood that the mean and mode of this set of data will remain the same if the data is collected from Grade 6 students. Once the predictions are developed, have students survey the Grade 6 students to confirm their predictions. Ask them questions such as:
- Based on the data collected, do the mean and mode differ for students in Grade 6? Why do you think that is?
- If you compare the mean and the mode for Grade 2 and Grade 6 students, what do you notice? What might explain the similarity or difference in results?
- Were your predictions correct? Why do you think so?
