D1.2 Collect data from different primary and secondary sources to answer questions of interest that involve comparing two or more sets of data, and organize the data in frequency tables and stem-and-leaf plots.
Skill: Collecting Data
Planning a data collection and carrying it out provides meaningful data.
The inquiry process is a comprehensive one that involves four steps: identifying the situation, collecting the data, organizing the data, and interpreting the results.
Once students have clarified the problem and formulated one or more questions of interest, they should plan and carry out a data collection. It is important to consider the different types of surveys, the different kinds of data, and the difference between the population and the sample when planning the data collection. Involving students actively in planning the data collection encourages them to make thoughtful choices and to look critically at the entire survey process.
Source: translated from Guide d’enseignement efficace des mathématiques, de la 4e à la 6e année, Traitement des données et probabilité, p. 44.
Questions to Ask
It is important to provide students with a variety of opportunities to plan a data collection. By interviewing students throughout this stage, educators help them to better understand the importance of choosing the type of survey and the type of data that are most appropriate for the question of interest, as well as identifying the population and, if necessary, the sample to be surveyed. In doing so, it helps students develop critical thinking skills, which will be very useful in the fourth step of the inquiry process.
Here are some ideas for questions that teachers can use to guide students through the planning of data collection.
Survey Type:
What type of survey is most appropriate for your question of interest? Why?
Type of Data:
- What kind of data will you collect?
- Does this kind of data lend itself well to your question of interest? Why?
Target Population:
- What is your target population?
- Is this the group that is the focus of your survey?
Modalities (Where, When, How):
- Where will you conduct your survey?
- When are you going to conduct your survey? Why is this a good time? If it were conducted at another time, would the results be the same?
- How will you go about obtaining the data you are looking for?
- How will you record the results of your survey?
Source: translated from Guide d’enseignement efficace des mathématiques, de la 4e à la 6e année, Traitement des données et probabilité, p. 57-58.
Skill: Organizing Data
Organizing data and representing it in tables and graphs helps to communicate information for interpretation. Once students have identified the situation and collected data, they must organize the data.
Why Organize the Data?
Gal (2002) indicates that data obtained in a survey are organized for further analysis or to communicate information. Since the purpose of the survey is to find an answer to one or more questions of interest, it is very difficult to base that answer on data that are presented in a haphazard fashion. By organizing the data collected, they can be presented in a way that summarizes them, highlights some of the information they contain, communicates their main characteristics and facilitates their interpretation.
Source: translated from Guide d’enseignement efficace des mathématiques, de la 4e à la 6e année, Traitement des données et probabilité, p. 62.
Knowledge: Primary Source
Primary data are data that are collected by the person conducting the survey. It is well suited to investigating issues that involve objects and people in the students' immediate environment. It is ideal for introducing students to data management, since students are generally more interested in the data they have collected themselves.
When students know the range of possible responses, they can facilitate the recording of data using a frequency table. For example, in a survey situation where a population is asked to identify the preferred type of soup, students can record a line in the row corresponding to each response in a table such as the one below. This counting strategy is called tallying. Every fifth line is drawn at an angle to the previous four lines, making it easier to count the results later. The Frequency column shows the total number of tallies in every row.
Example
Favorite Soups
| Type | Count | Frequencies |
|---|---|---|
| Chicken Noodle Soup |  |
7 |
| Broccoli Soup |  |
4 |
| Cream of Mushroom soup |  |
8 |
| Vegetable Soup |  |
3 |
| Tomato Soup |  |
1 |
Source: translated from Guide d’enseignement efficace des mathématiques, de la 4e à la 6e année, Traitement des données et probabilité, p. 50-51.
Knowledge: Secondary Source
Secondary data are data that have been collected by an individual or organization (for example, researcher, company, association) other than the person conducting the survey. Secondary data can be found in books, encyclopedias, journals, newspapers, and on the Internet. They are particularly useful for answering questions of interest for which it is difficult or impossible to collect primary data (for example, over the years, what was the size of the Francophone population in major Canadian cities?). They can also be used to interpret other data with which they are related to.
Educators need to help students develop the ability to judge the relevance of the secondary data they are exposed to on a daily basis. This can be accomplished by continually educating them about the importance of checking the credibility of various sources of information, as well as the importance of making good use of the data presented. The graphs and data that appear in journals provide an authentic and meaningful context for managing data.
Data Gathering Using the Internet
Access to the Web gives students the opportunity to participate in national and even international projects that place them in authentic data collection and exchange situations, thus fostering collaboration among students from different countries.
For example, the Census at School project "is an international online project that introduces students in grades 4 to 12 to the world of surveys and statistics. This project originated in the UK in 2000, and schools in Australia, Canada, New Zealand and South Africa are now taking part. Young people from these countries anonymously complete a questionnaire in class. They provide non-confidential information such as their height, travel time between home and school, and their favorite subject. Responses are fed into a national database, which will then be added to an international database maintained in the UK."
Since students are expected to recognize the difference between primary and secondary data by Grade 4, such projects are valuable tools for investigating a topic of particular interest and concern to them.
*From Statistics Canada, Census at School - Canada! (Accessed June 23, 2022.)
Source: translated from Guide d’enseignement efficace des mathématiques, de la 4e à la 6e année, Traitement des données et probabilité, p. 51-52.
Knowledge: Question of Interest
Self-selected question for which data must be collected. The question can manage not only preference, but also magnitude, quantity or general information.
Source: The Ontario Curriculum. Mathematics, Grades 1-8 Ontario Ministry of Education, 2020.
Knowledge: Types of Survey
Data Collection by Observation
In an observational survey, one records what one sees or does.
Examples
- We count the number of birds we see in the schoolyard at specific times.
- The number of cars that pass an intersection during a given time interval is noted.
- We count the number of times we go to the sports centre in a month.
- Every day for a week, we note the time we go to bed and the time we get up.
In planning a data collection using observations, it is necessary to plan where, when, what, and sometimes how to observe (for example, how to distinguish between a car making an incomplete stop at an intersection and a car making no stop). It is also possible to plan whether all observations will be made by one person or whether they will be made by several people at the same time to ensure better accuracy.
Data Collection by Measurements
When collecting data by taking measurements, measurements are taken in situations that involve a limited number of variables, as is the case in an experiment.
Examples
- We measure the time required by students in Grade 4 to read a given text.
- The amount of rain (in millimeters) that falls on each day in May is measured.
When planning to collect data by measurement, it is important to consider where, when and how to collect the measurements, and whether all measurements will be collected by one person or by several people at the same time to ensure greater reliability.
Data Collection by Means of an Experiment
In a data collection by means of an experiment, the data are derived from a manipulative, scientific activity that requires adherence to certain preset parameters and, often, the use of precise measurement techniques and tools.
Examples
- At specific intervals, plants are measured for growth, with some receiving a small amount of nutrients, some receiving a larger amount, and some receiving no nutrients, to see if nutrients are contributing significantly to plant growth.
- Every 30 seconds, the temperature of any liquid that has been heated to 100°C is taken and allowed to cool. The experiment is repeated with various liquids in order to compare the rate at which they cool.
When planning an experiment, the scientific approach must be used and the reliability of the data collection method must be ensured. Variables that may render the results invalid must be controlled for and neutralized.
Poll Survey
When conducting a survey, data are collected by asking a number of individuals about a particular topic. The questions often take the form of a questionnaire that can be answered in writing or orally.
Examples
- Students in the class are asked how many hours they spend watching television each week.
- Grade 6 students are asked what kind of music they prefer.
In planning a survey, it is important to write the survey questions well to ensure that they are clear and objective. It is also important to anticipate the responses that may be given and sometimes to group them into categories.
Secondary Data Collection
Existing data on a topic is frequently available from an electronic database (for example, website) or in a printed document (for example, book, magazine, encyclopedia).
Examples
- We want to compare the population of Canadian provinces and territories.
- We want to compare students' preferences for school subjects.
When planning a survey using existing data, it is important to check whether the data are available, where and how to obtain them, and to ensure that the source is reliable.
Source: translated from Guide d’enseignement efficace des mathématiques, de la 4e à la 6e année, Traitement des données et probabilité, p. 46-48.
Knowledge: Frequency Table
A frequency table helps organize the data from a survey and summarizes it quantitatively, making it easier to construct a bar graph and develop an answer to the question of interest. For example, students in the class take a survey to find out how everyone woke up this morning. There are four response choices: A parent woke me up, I woke up by myself, My alarm clock woke me up, and Other means. Students complete the survey by checking the appropriate response on an individual sheet of paper and then the responses are tabulated. The result of this tabulation can be represented by a frequency table; the Number of Students column shows the frequencies.
How the Students Woke Up This Morning
| Mean of Waking Up | Number of Students |
|---|---|
| A parent woke me up. | 7 |
| I woke up by myself. | 4 |
| My alarm clock woke me up. | 8 |
| Other means | 3 |
| Total | 22 |
In the situation where students take turns answering the poll orally, a modified frequency table can be used that contains a column for recording the data.
How the Students Woke Up This Morning
| Mean of Waking Up | Count | Number of Students |
|---|---|---|
| A parent woke me up. | |
7 |
| I woke up by myself. | |
4 |
| My alarm clock woke me up. | |
8 |
| Other means | |
3 |
| Total | 22 |
In some situations, one may want to group the data in the frequency table according to various categories. For example, the data obtained from the survey on daily fruit and vegetable consumption can be summarized in a frequency table as follows.
Daily Consumption of Fruits and Vegetables
| Number of Servings | Number of Students |
|---|---|
| 0 | 0 |
| 1 | 1 |
| 2 | 2 |
| 3 | 2 |
| 4 | 1 |
| 5 | 5 |
| 6 | 6 |
| 7 | 2 |
| 8 | 1 |
| 9 | 0 |
| Total | 20 |
This table contains ten answer choices, but the frequency of several choices is only 1 or 2. Therefore, it may be more useful to group the data two by two as in the following table.
Daily Consumption of Fruits and Vegetables
| Number of Servings | Number of Students |
|---|---|
| 0 - 1 | 1 |
| 2 - 3 | 4 |
| 4 - 5 | 6 |
| 6 - 7 | 8 |
| 8 - 9 | 1 |
| Total | 20 |
This table may be considered more useful and easier to manage, as it summarizes the data into five categories instead of ten. For example, it quickly shows that almost half of the students eat 6 or more servings of fruits and vegetables daily. On the other hand, if the objective of the survey is to determine how many students consume exactly 6 servings of fruits and vegetables, this table is not very useful since it is impossible to say how many of the 8 students represented in category 6 – 7 servings consumes 6 servings and how many consumes 7. So creating a frequency table can generate useful and interesting discussions in class. In addition to guiding the students on how to create a table of frequencies, the teaching staff must discuss with them the possible choices and lead discussions on the advantages and limits of each of the tables.
Source: translated from Guide d’enseignement efficace des mathématiques, de la 4e à la 6e année, Traitement des données et probabilité, p. 67-70.
Knowledge: Stem and Leaf Plot
The stem-and-leaf plot is used to organize and represent a set of numerical data. Visually, a stem-and-leaf plot is similar to a bar graph, Numerically, the characteristics of the stem-and-leaf plot allows one to see the minimum value, maximum value, median, mode and range of the data.
For example, consider the following situation:
The 23 students in the class each opened a box of candy and counted the number of candies in it. When they compared their results, the students were surprised to discover that the boxes did not all contain the same number of candies. Here are the numbers of candies in each box: 18, 20, 24, 22, 23, 23, 19, 23, 24, 25, 27, 23, 18, 23, 23, 22, 20, 31, 19, 22, 12, 22, 20.
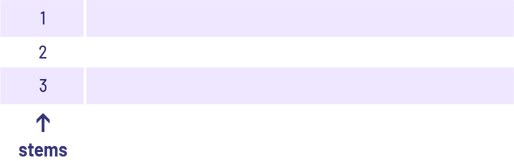
To create a stem and leaf plot, it is easiest to first place the data in ascending order: 12, 18, 18, 19, 20, 20, 22, 22, 22, 22, 23, 23, 23, 23, 23, 24, 24, 25, 27, 31. Next, write down the numbers corresponding to the tens, 1, 2, and 3, and place them vertically to form what are called the stems of the plot.
The numbers 12, 18, 18, 19 and 19 are then plotted in the first row with only the units of each number, in other words, 2, 8, 8, 9 and 9. These numbers, separated by a constant space, form the leaves of the graph. The same is done for the numbers 20 to 27 by plotting the units of each number in the row that corresponds to the tens digit 2, and so on. The result is the following graph.
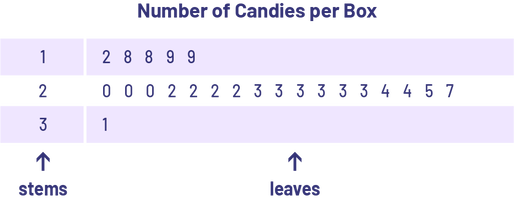 image The first column of the table titled 'Number of Candies per Box' contains the numbers one, two and three. The word 'stems' points down the column with an arrow. The following numbers, which represent leaves, are associated with the number one: two, 8, 8, 9, 9. The numbers associated with the number two are: zero, zero, zero, two, two, two, 3, 3, 3, 3, 3, 4, 4, five, 7. The number associated with the number three is: one.
In each row, the leaves, which correspond to the numbers of the units of the data, are linked to the stem associated with the corresponding ten. The graph looks like a horizontal bar graph, while presenting all the data as in a frequency table. It allows you to quickly identify some typical values, such as the minimum value of 12, the maximum value of 31, the median (the 12th data) of 22 and the mode (the data that appears most often) of 23.
When there is a large amount of data, it can be more difficult to place it in order on the graph without errors, so an intermediate graph can be created in which these data are placed as they are read, without placing them in ascending order. For example, in a survey, the foot length, in centimetres, of all Grade 6 students was measured and the following results were obtained.
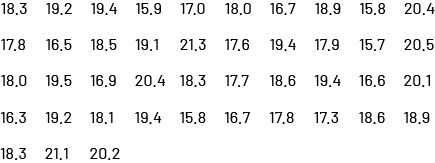
The leaves of the graph correspond to the digits of the data associated with the tenths and the stems correspond to the other digits of the data, in other words 15, 16, 17, 18, 19, 20 and 21. We therefore prepare an intermediate graph that contains 7 rows and we place the data in it in the order that we see them, in other words starting with 18.3, followed by 19.2, and so on. We then obtain the following table.
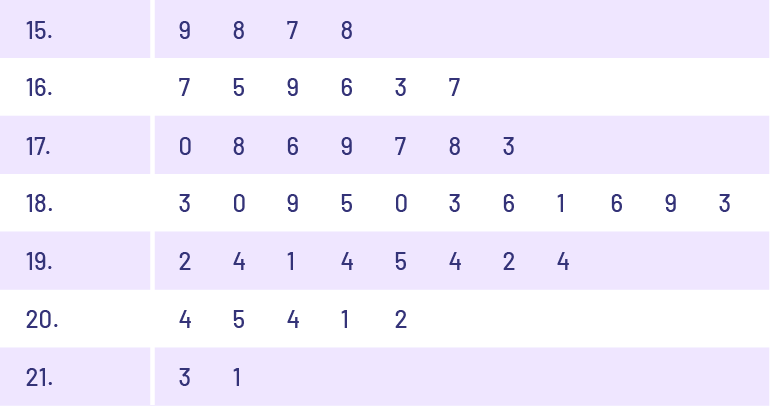 image The numbers associated with the number 15 are: 9, 8, 7, 8. The numbers associated with the number 16 are: 7, 5 9, 6, 3, 7. The numbers associated with the number 17 are: zero, 8, 6, 9, 7, 8, 3. The numbers associated with the number 18 are: 3, zero, 9, 5, zero, 3, 6, one, 6, 9, 3. The numbers associated with the number 20 are: four, five, four, one, two. The numbers associated with the number 21 are: three, one.
It is now easier to place the sheets in ascending order, as each row contains a small number of sheets.
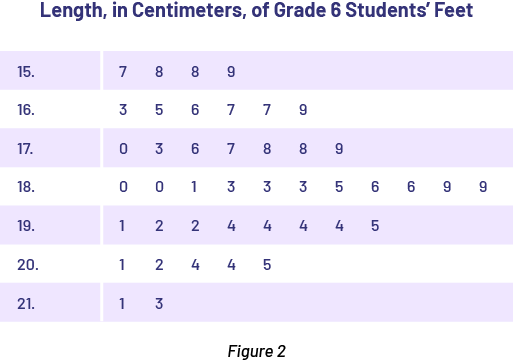 image Figure Two is a table with the title 'Length, in centimeters, of Grade 6 students' feet'. In line 15, the numbers 7, 8, 8, 9 are found. In line 16, the numbers 3, 5, 6, 7, 7, 9 are found. In line 17, the numbers zero, 3, 6, 7, 8, 8, 9 are found. In line 18, the numbers zero, zero, one, three, three, three, five, 6, 6, 9, 9 are found. In line 19, the numbers one, two, two, 4, 4, 4, 4, 5 are found. In line 20, we find the numbers one, two, 4, 4, 5. And in line 21, we find the numbers one and three.
Characteristics of a Stem and Leaf Plot
- It has a title (for example, Number of candies per box).
- It contains two columns; the one on the left groups the stems, and the one on the right groups the leaves.
- The leaves, which usually correspond to the data digits associated with units or tenths, are placed in ascending order and are equally spaced.
- The stems, which correspond to the beginning digits of the numbers in the data, are also placed in ascending order.
Source: translated from Guide d’enseignement efficace des mathématiques, de la 4e à la 6e année, Traitement des données et probabilité, p. 77-79.