D1.2 Collect data, using appropriate sampling techniques as needed, to answer questions of interest about a population, and organize the data in relative-frequency tables.
Activity 1: Identify the Situation
In this activity, using a contextualised situation, we demonstrate the way teachers engage students in clarifying the problem and formulating questions of interest. In addition, since the choice of the question of interest suggests the use of survey through a poll, the step of formulating survey questions is also presented.
Note: This scenario can be adapted to a multitude of contexts, to the dynamics of the group, and to a contextualized situation that deals with current events.
Earth Day
As part of the planning for learning about data, Martin Tremblay, a junior teacher, wants to conduct an investigation with his students. Seeing that Earth Day is approaching, he decides to contextualize the situation by proposing the reading of a text on pollution. He gives each student a copy of the text Respirer c'est mauvais pour la santé (due to copyrights, this text is only available in French).
Mr. Tremblay asks the students, in an independent reading session, to read the text carefully. Then, he encourages them to clarify the problem by asking them questions such as:
- Had you ever heard of smog before reading this?
- What are some of the causes of air pollution?
- What do you think are the possible solutions?
- Have you ever witnessed "impressive natural phenomena"?
- Do you know people who have respiratory problems like Luis'?
- Do you think that other types of pollution can have an impact on people's health?
All students' ideas are written on the board and then organized using a concept map.
Example
image Concept map in which students' ideas are organized. In the middle of the map, in a bubble, it says "Smog". An arrow points to a bubble at the top. In the arrow it says "it causes", in the top bubble it says "Air pollution". Next to this bubble, there is an arrow pointing to another bubble "respiratory illnesses". Back to the center bubble "Smog". There is an arrow pointing down to the left. In the arrow it says "solutions". It points to a bubble in which it says "concrete actions". There are two arrows that go from this bubble to two other bubbles, "public transportation" and "carpooling". Back to the center bubble "Smog". There is an arrow pointing down to the right. The arrow says "caused by". It points to three bubbles that say "altitude and heat", "lifestyle" and "cars".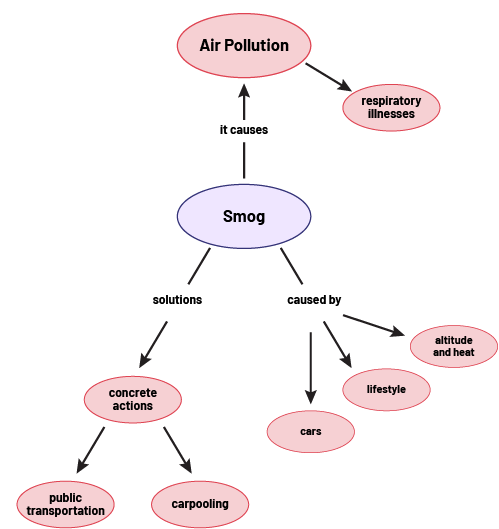
Note: from the analysis and discussion of this concept map, students will be presented with many important considerations related to the issue of air pollution. Students then realize that they have the opportunity, through their questions, to guide the direction of the survey. Mr. Tremblay then leads a discussion oriented towards the formulation of questions of interest, of which the following is an extract.
Mr. Tremblay then leads a discussion geared towards the formulation of questions of interest, an excerpt of which follows.
Mr. Tremblay: Is there anything else you would like to know about pollution other than the ideas on the board?
Student 1: I wonder what other diseases might be caused by pollution.
Student 2: Is smog a recent phenomenon?
Student 3: How many people use public transit to get to work? How many adults in families of students at our school use public transit?
Student 4: Are there Canadian cities as polluted as Mexico City? Which are the most polluted Canadian cities and how do they compare to Mexico City?
Student 5: Could drivers in Ontario not use their cars one day a week like the citizens of Mexico City do in order to reduce the emission of harmful pollutants? What would be the consequences of such a shift in behaviour?
Student 6: I think we can make a difference too. I wonder if the students at school would be willing to take part in activities to highlight the importance of air quality.
The class agrees to investigate the question Student 6 asked. The students choose to conduct a survey of other students in the school in order to obtain data that would allow them to answer the question. The following excerpt shows how Mr. Tremblay helps students formulate questions for the survey.
Mr. Tremblay: If we were to survey the students in the school about the importance of air quality-awareness activities, what questions might we ask them?
Student 1: We could ask them if they want to improve the school's air quality.
Mr. Tremblay: What possible answers could they give to that question?
Student 2: Either yes or no. Then we would know if the majority of students want to improve air quality.
Student 3: If we want students to participate, we should ask for suggestions for activities or actions in our survey question. For example, we could ask them a multiple choice question such as:
To celebrate Earth Day, would you:- improve the air quality in the classroom?
- buy a new plant for the classroom?
- organize a wind festival?
- plant trees in the schoolyard?
Mr. Tremblay: We are proposing a series of possible actions or activities. What does the person who chose the statement "improve classroom air quality" tell you about the action they want to take?
Student 4: This student might also want to buy a new green plant for the classroom.
Mr. Tremblay: OK then, how can you rephrase your question to make it more specific?
Student 3: If we really want to know about a student's favourite activities, perhaps we should ask them which ones they prefer.
Student 6: Younger students have different tastes than older ones, so we could also ask them if they are in Primary Division or Junior Division.
After this discussion, students will design a questionnaire with a few questions. The data collected will provide an interesting picture of the situation. The following is a sample questionnaire developed by the class.
Earth Day Activities
Circle the appropriate choice:
Are you in Primary or Junior Division?
- P
- J
To celebrate Earth Day (April 22nd), the Grade 5 students will be organizing an activity related to air quality. From the activities below, indicate with a check mark which one you would most like to participate in:
- Make a presentation during the Earth Day ceremony; for example, plant a tree, recite a poem, perform a skit.
- Build kites to promote wind energy.
- Take a walk outdoors.
- Participate in the creation of a mural that would illustrate elements related to air quality.
- Write a short piece, such as a poem or an article, about the importance of air quality that will later be posted on the school's website.
Students are now ready to begin the next steps in the inquiry process: collecting data, organising the data, and interpreting the results.
Source: translated from Guide d’enseignement efficace des mathématiques, de la 4e à la 6e année, Traitement des données et probabilité, p. 38-42.
Activity 2: Planning and Data Collection
The following is a contextualized situation, illustrating how a teacher can help students plan and conduct a data collection.
Note: This scenario can be adapted to a variety of contexts, to the dynamics of the group, and to a contextualized situation that deals with current events.
Coloured Wristbands for a Good Cause
During a discussion with her Grade 5 students about world peace, teacher Ms. Montpetit presents the following situation: I noticed that many charities sell coloured wristbands for fundraising or to promote a cause. I thought we could use this strategy to promote peace with students at our school. What do you think? Since we will need to order expandable wristbands, I am wondering what size of wristband we should choose. Do you have any ideas about how we could determine what size of wristband would be appropriate for all the students at our school?
Even if the teacher has already more or less stated the question of interest, she takes the time to make sure that the students have understood the situation by asking questions such as:
- Have you ever seen someone wearing one of these stretchy wristbands?
- How can these wristbands be used in schools to promote peace?
- Before ordering the wristbands, what do we need to determine?
- Who could summarize the question that prompted our inquiry? (What size wristband should we order if we want the wristbands to fit all students in the school?)
Ms. Montpetit then leads a discussion focused on planning for data collection.
| Ms. Montpetit | Students | ||||
|---|---|---|---|---|---|
| What information do we need to determine the size of the wristbands we will order? | Student 1. - We need to know the wrist measurements of the students in the school. | ||||
| How do we go about getting this data? | Student 2. - We could go from class to class and take the measurements. | ||||
| Do we need to measure the wrists of every student in the school? |
Student 3. - I think it would take a very long time to take all these measurements. Student 4. - Only a small number of students could have their wrists measured. |
||||
| How will you select participants? |
Student 5. - I think they should be chosen randomly or else we might be choosing our friends, which wouldn't really represent all the students in the school. Student 1. - Students should be selected from each class because the measurement of our wrist changes as we grow. Student 2. - We could ask each teacher to provide us with a list of the names of the students in their class and then randomly select 5 students per class. Student 3. - Since there are 12 classes in grades 1-6, that would give us 60 measurements to take. This is doable! |
||||
| Is this enough to get a good idea of the typical wrist size of students in the school? |
Student 4. - All grades would be represented by 5 students. Since there are 2 classes of students per grade, that means each grade would be represented by 10 students. Student 5. - By randomly selecting the 5 participants from each class, all students in the school would have an equal opportunity to participate. That's fair! |
||||
| How will you select students randomly within each class? |
Student 1. - You could write a number beside each name on the list. Then write all of these numbers on slips of paper, place them in a bag and draw 5 randomly. |
||||
| How will you collect the data? |
Student 2. - We could measure selected students’ wrists with a tape measure. Student 3. - In this way, we will only have to record the results of our inquiry by writing them down on a sheet of paper. Student 4. - I wonder if there is a big difference between the wrist measurement for Grade 1 students and Grade 6 students. |
||||
| What might the table that records the participants' data look like? |
Student 2. - I can draw one.
|
Ms. Montpetit then tells the students that the data collection will take place the next day - she needs to inform the other teachers about this inquiry and get their list of students' names. The next day, Ms. Montpetit divides the students into 12 teams. She gives each team a list of students' names from a classroom group. She then asks the teams to use whatever strategy they choose to randomly select the names of five students to be included in the sample. The teams then go to the classroom groups to measure the wrist circumference of the selected students and to record the data in the table designed for this purpose. When all the teams return, the students are to transcribe their data in a common table.
Example
| Wrist Measurement (in cm) | Grade | Number of Students |
|---|---|---|
| ... | ... | |
| 12 | 4 | |
| 10 | 4 | |
| 13 | 5 | |
| ... | ... |
Students are now ready to take the next steps in the inquiry process, which are to organize the data and interpret the results.
Source: translated from Guide d’enseignement efficace des mathématiques, de la 4e à la 6e année, Traitement des données et probabilité, p. 58-61.