D2.2 determine and compare the theoretical and experimental probabilities of two independent events happening.
Skill: Determining and Comparing Probabilities
Proportional Reasoning
There is an important connection between probabilistic thinking and proportional reasoning. Proportional reasoning allows students to recognize the equivalence relationship between two probability situations, thereby contributing to their understanding of the concept of theoretical probability. Teachers should provide students with a variety of activities that encourage them to make this connection.
Example
The teacher presents the students with two bags and their contents. Bag A contains three green cubes and two purple cubes. Bag B contains six green cubes and four purple cubes. The teacher then asks, "Which bag do you think has a greater probability of drawing a green cube?"
A student responds, "I think it's with bag B, because there are more green cubes, so I have more chances to pick one." This thinking is typical of a learner who has not yet acquired proportional reasoning in a probability context. The student did not realize that the two situations are equivalent, since both the number of green cubes and the number of purple cubes were doubled.
Another student says: “The probability of drawing a green cube from bag A is \(\frac{3}{5}\) whereas with bag B, the probability is \(\frac{6}{ 10}\). Since \(\frac{3}{5}\) = \(\frac{6}{10}\), then the probability is the same for each bag. This answer demonstrates the application of proportional reasoning in the context of equivalent fractions.
Finally, another student rearranges the cubes and concludes, “In bag A, I see three green cubes out of a total of five cubes, while in bag B, I see three groups of green cubes out of a total of five groups. I judge that it is just as likely to pick a green cube from bag A as from bag B.” Rearranging the cubes is a concrete way to represent the proportionality relationship.
Source: translated from Guide d’enseignement efficace des mathématiques, de la 4e à la 6e année, Traitement des données et probabilité, p. 144-145.
Knowledge: Theoretical Probability
The analysis of data collected during randomized experiments allows us to better understand the concept of theoretical probability.
The theoretical probability quantifies the randomness and uncertainty of an event or outcome. This quantity can be represented using a fraction between 0 and 1. For example, in the game of heads or tails, the theoretical probability of getting the outcome tails is equal to \(\frac{1}{2} \). This fraction indicates that the game has two equally likely outcomes and that one of these outcomes is tails. In other words, in this game, there is a 50/50 chance of getting the outcome tails.
Teachers should be aware that if all possible outcomes of an experiment are equally likely, the theoretical probability of any outcome A is defined, formally, as follows:

Thus, if one seeks to determine the probability of obtaining an even number by rolling a six-sided die, it suffices to recognize that there are six possible outcomes (1, 2, 3, 4, 5, and 6) and that three of these outcomes correspond to an even number (2, 4, and 6). We can therefore say that the theoretical probability of obtaining an even number is equal to \(\frac{3}{6}\), that is to say that there are three possibilities out of six that the outcome corresponds to an even number. The notation P(A) is commonly used to describe the probability of any outcome A. Thus, in the previous situation, we could write P(even number) = \(\frac{3}{6}\). Note, however, that in the Junior Division, it is best to help students develop an understanding of the concept of theoretical probability without placing too much emphasis on definition or formal notation. The strategies presented in the following section support this.
In some situations, it is realized that a desired outcome can never occur, for example, getting a number greater than six with the roll of a die. In these situations, the probability of that outcome is said to be 0. In other situations, it is certain that the desired outcome will occur (for example, getting a number less than seven with the roll of a die). In these situations, the probability of that outcome is said to be equal to 1.
Theoretical probability helps us make informed decisions in any random situation. Since in such situations it is impossible to predict the outcome without the risk of being wrong, we can reduce this risk by determining the theoretical probability of each outcome and choosing the outcome with the highest probability. This is a way of "mathematizing chance".
Source: translated from Guide d’enseignement efficace des mathématiques, de la 4e à la 6e année, Traitement des données et probabilité, p. 137-138.
Example
Teachers present students with the spinner below and ask them to determine the probability of the arrow stopping in the yellow sector.
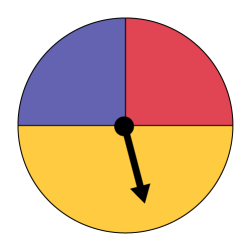
This situation may cause a cognitive imbalance for some students. Intuitively, they know that it is more likely that the arrow will stop in the yellow sector than in the red or blue sectors. However, they tell themselves that there are only three possible outcomes (yellow, blue, and red) and therefore, that the probability that the arrow will stop in the yellow sector should be equal to \(\frac{1}{3}\). Of course, the flaw in this reasoning is that the three results are not equally likely, since the area of the yellow sector is greater than the area of each of the other two sectors. Teachers can then suggest that students divide the yellow sector as follows.
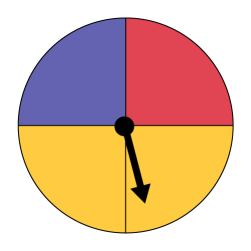
We can now consider that there are four possible outcomes (yellow, yellow, blue, and red) and that they are equally likely, since the area of each sector is the same. The probability that the arrow stops in the blue sector is \(\frac{1}{4}\). The same is true for the probability that it stops in the red sector. However, the probability that the arrow stops in the yellow sector is equal to \(\frac{2}{4}\). It is therefore twice as likely that the arrow will stop in the yellow sector than in the blue or red sectors.
Note that the other examples of manipulatives do not provide as much opportunity to emphasize the idea of equally likely outcomes. When using a die or a coin, it is assumed that the outcomes are equally likely, in other words, that the die is not loaded or that the coin can naturally fall as often on one side as on the other. In the case of the bag of marbles, it is assumed that it is not possible to distinguish one marble from the other by touch, as it would be if, for example, the red one were larger than all the others. Therefore, when using these manipulatives, the teacher should encourage students to always establish the premise of equally likely outcomes.
Source: translated from Guide d’enseignement efficace des mathématiques, de la 4e à la 6e année, Traitement des données et probabilité, p. 140-141.
Theoretical probability is an abstract mathematical concept that is not always easy to grasp. However, understanding it is essential to the development of probabilistic thinking. To ensure that this understanding is not simply a matter of learning a formula, it must be the result of a lengthy process in which teachers expose students to a variety of probability games, situations, or experiments that allow them to confront theory and practice. This approach often creates an imbalance in students, who may be led by intuition or faulty analysis in the face of a particular situation. Even among adults, it is very common to misunderstand a seemingly simple random situation. Therefore, in the Junior Division, it is very important to keep situations relatively simple and to work with concrete materials. The following describes how teachers can help students develop this conceptual understanding.
Development of the Concept of Theoretical Probability
In order to develop an understanding of the concept of theoretical probability, students must use both their intuitive and analytical thinking. It is therefore important that teachers present them with situations that involve both theory and practice in order to encourage a back-and-forth between these two modes of thinking.
From an early age, students develop an informal understanding of the concept of probability. For example, using a die in the context of various games allows them to recognize that there are six possible outcomes. Then, over time, students intuitively understand although these outcomes are random, they are also equally likely. In the junior grades, students gradually develop an understanding of the theoretical concept of probability. In Grade 4, for example, students may state that there is a one-in-six chance of getting the number four with the toss of a die. In Grade 5, students learn to express this probability using a fraction, in other words, \(\frac{1}{6}\). In Grade 6, students can also use a decimal or a percent to represent the probability of an outcome.
Manipulatives
To help students develop an understanding of the concept of theoretical probability, teachers should use a variety of manipulatives that make it easy to visualize possible outcomes. The table below provides some examples.
| Material | Theoretical Probability |
|---|---|
|
Bag of marbles or tokens  |
If a marble is randomly drawn from a bag like the one shown here, there are 5 possibilities as to the colour of this marble. Since there is only one marble of each colour, the probability of obtaining, for example, a green marble is equal to \(\frac{1}{5}\). |
|
Die 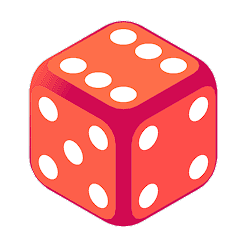 |
When we throw a 6-sided die, the outcomes 1, 2, 3, 4, 5, 6 are equally likely. So the probability of obtaining the number 6 is \(\frac{1}{6}\). Other dice models can also be used. 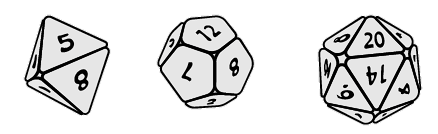 |
|
Spinner 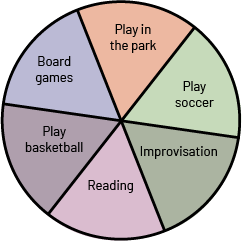 |
On the spinner shown here, there are 6 sectors of equal area. Therefore, the probability that the arrow will stop in the Play Soccer sector is equal to \(\frac{1}{6}\). |
|
Coin  |
When a coin is tossed, the heads and tails outcomes are equally likely. Therefore, the probability of getting tails is \(\frac{1}{2}\). |
|
Two-coloured token  |
When a two-coloured token is tossed, the outcomes are equally likely. Therefore, the probability of getting the red side of the token is equal to \(\frac{1}{2}\). |
Equally Likely Outcomes
This material encourages students to develop an understanding of the concept of theoretical probability that is based on both intuition and reasoning, since in each case the possible outcomes are readily observable and limited in number. However, the spinner model emphasizes, more than other models, the importance of ensuring that all possible outcomes are truly equally likely.
Source: translated from Guide d’enseignement efficace des mathématiques, de la 4e à la 6e année, Traitement des données et probabilité, p. 138-140.
Knowledge: Experimental Probability
Probability Experiment
Probability experiments are essential to developing a sound understanding of the concept of theoretical probability. Thus, when students have established the theoretical probability of an outcome, teachers can suggest that they verify this probability experimentally. This activity also allows them to better understand that uncertainty is inherent in any situation involving chance. For example, even if students state that the theoretical probability of an outcome is \(\frac{1}{4}\), there is no guarantee that they will get that outcome one quarter of the time during an experiment.
Source: translated from Guide d’enseignement efficace des mathématiques, de la 4e à la 6e année, Traitement des données et probabilité, p. 142.
Probability experiments are used to support or challenge intuitive reasoning and are central to the development of probabilistic thinking.
Experimental Probability
Experimental probability is used in situations where it is impossible to determine the theoretical probability of a particular event or outcome, such as weather forecasting, estimating life expectancy, or determining the probability of hitting a free throw in basketball. According to the curriculum, students first encounter the concept of experimental probability in Grade 5.
This concept should be taught in real-life situations. For example, teachers can present various situations involving picking an object from a bag whose exact contents are unknown. They can also present situations where the possible outcomes are not necessarily equally likely.
Source: translated from Guide d’enseignement efficace des mathématiques, de la 4e à la 6e année, Traitement des données et probabilité, p. 150.
Example 1
The teacher forms teams of two students. The teacher explains that they are to conduct an experiment that involves tossing a coin 20 times and recording the results. Before proceeding, students must predict how many times they will get heads and tails. Knowing that the probability of each outcome is equal to \(\frac{1}{2}\), most students may predict that they will get heads 10 times and tails 10 times.
When the students have completed the experiment, the teacher asks each team to record their results in a table.
Tossing a Coin, 20 Times
| Team | Results | T | H | |||
|---|---|---|---|---|---|---|
| 1 | H-T-H-H-T | T-T-H-T-T | T-H-H-T-H | T-H-H-H-H | 9 | 11 |
| 2 | T-T-H-T-T | T-T-T-H-T | H-T-T-T-T | H-T-H-H-H | 13 | 7 |
| 3 | T-T-T-T-T | H-H-H-T-T | T-H-H-H-T | T-H-H-T-H | 11 | 9 |
| 4 | H-H-T-H-T | T-T-T-H-T | T-H-T-T-H | H-T-H-T-H | 11 | 9 |
| 5 | H-H-T-T-T | T-H-H-H-T | T-H-H-T-H | T-H-T-T-H | 10 | 10 |
| 6 | H-T-H-H-T | H-T-H-H-H | T-T-T-H-H | H-T-T-H-T | 9 | 11 |
| 7 | T-T-T-T-H | H-T-T-H-H | T-T-T-H-T | H-H-H-T-T | 12 | 8 |
| 8 | T-T-T-H-H | T-T-T-H-H | H-H-T -H-H | H-T-T-H-T | 10 | 10 |
| 9 | H-T-T-T-T | T-T-T-T-T | T-H-T-H-T | T-T-H-T-T | 16 | 4 |
| 10 | T-H-T-T-T | H-H-T-T-T | H-T-H-T-H | T-H-T-H-T | 12 | 8 |
| Total | 113 | 87 | ||||
To help students better understand the concept of theoretical probability, the teacher encourages them to analyze the results. Students can point out that only experiments 5 and 8 resulted in 10 tails and 10 heads, while experiments 1, 3, 4, and 6, were very close to this distribution. Students may also notice that the results of experiment 9 (16 tails and 4 heads) are very different from what the theoretical probability might suggest. However, this result helps to emphasize the idea that all outcomes are possible, even those that seem unlikely. Students can also note that, out of a total of 200 throws, tails were obtained 113 times and heads 87 times.
Note: If the theoretical probability of any outcome of an experiment is known, the Law of Large Numbers states that the more times the experiment is performed, the closer the ratio of the frequency of the outcome to the number of trials will be to the theoretical probability. This law is not studied in the junior grades, but teachers can use probability experiments to introduce the general idea to students.
Source: translated from Guide d’enseignement efficace des mathématiques, de la 4e à la 6e année, Traitement des données et probabilité, p. 142-143.
Example 2
Teachers have a box of identical thumbtacks and shows students that if you throw a thumbtack in the air, it can fall pointing up or down.

Even though there are only two possible outcomes, there is no reason to believe that they are equally likely. Therefore, it is not possible to determine the theoretical probability of each. Teachers can then remind students that on various occasions, they had:
- determined the theoretical probability of any outcome;
- performed a probability experiment to check its plausibility;
- found that with a fairly large number of trials, the ratio of the frequency of the desired outcome to the number of trials was comparable to the theoretical probability.
The teacher explains to students that experimental probability makes use of this finding, that is, if one performs a probability experiment enough times and records the frequency of each outcome, that frequency can be used to determine an approximation of the theoretical probability.
The teacher groups the students in pairs and gives a thumbtack to each team. The teacher asks them to make 20 throws, record the results, and determine, using a fraction, what the probability of each result might be. For example, one team gets the following results: 12 times pointing up and 8 times pointing down. Students could then say that the probability of the thumbtack falling pointing up is about \(\frac{12}{20}\) and the probability of it falling pointing down is about \(\frac{8}{20}\).
The teacher then leads a mathematical discussion to highlight the variability in the teams' answers and suggests that they add up the frequencies obtained by each team to get a more reliable approximation of each probability.
Source: translated from Guide d’enseignement efficace des mathématiques, de la 4e à la 6e année, Traitement des données et probabilité, p. 150-151.
Knowledge: Independent Events
Two events are independent if the probability of one event occurring does not influence the probability of the other event occurring. For example, the probability of rolling a die the first time does not influence the probability of rolling a die the second time.
Example
Probability Experiments With Two Independent Events
- Roll two dice, 20 times
- Toss two coins, 15 times
- Roll a die and toss a coin, 30 times
Source: The Ontario Curriculum. Mathematics, Grades 1-8 Ontario Ministry of Education, 2020.