D2.2 Determine and compare the theoretical and experimental probabilities of two independent events happening.
Activity 1: Situation with Two Successive Choices
Present the following situation to the students:
Veronica would like to do an activity with one of her friends. She hesitates between asking Amelie, Julie, Sophie or Fanny, and she hesitates between going to the park, riding a bike, or going to the pool. If she decides to choose the friend and the activity at random, what is the probability that Veronica:
- goes to the pool with Julie?
- does an activity with Fanny?
- rides a bike?
Students can draw two spinners to better visualize the situation.
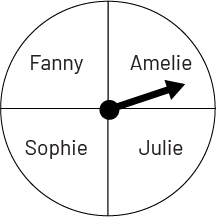
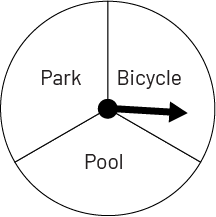
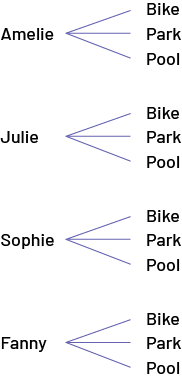
We are interested in the probability of the combined outcomes when the two arrows are rotated. First, we need to determine and list the possible equally-likely outcomes. If the first arrow stops on the name Amelie, the second arrow can stop on the activity Park, Bike, or Pool. The same thing happens if the first arrow stops on the name Julie, Sophie, or Fanny. We can quickly see that there are 12 equally likely outcomes, and we can represent them using:
a tree diagram;
a table;
| Bike | Park | Pool | |
|---|---|---|---|
| Amelie | Cycling with Amelie | Park with Amelie | Pool with Amelie |
| Julie | Cycling with Julie | Park with Julie | Pool with Julie |
| Sophie | Cycling with Sophie | Park with Sophie | Pool with Sophie |
| Fanny | Cycling with Fanny | Park with Fanny | Pool with Fanny |
an ordered list.
Amelie and bike, or park, or pool
Julie and bike, or park, or pool
Sophie and bike, or park, or pool
Fanny and bike, or park, or pool
Cycling with Amelie, or Julie, or Sophie, or Fanny
Park with Amelie, or Julie, or Sophie, or Fanny
Pool with Amelie, or Julie, or Sophie, or Fanny
Regardless of the representation used, students can then see that there is only 1 outcome among the 12 possible equally-likely outcomes that corresponds to going to the pool with Julie. The probability that Veronica goes to the pool with Julie is therefore equal to \(\frac{1}{12}\). To answer the other two questions, students can refer to the 12 possible outcomes or only to the spinner corresponding to the question. For example, the probability that Veronica will do an activity with Fanny is equal to \(\frac{3}{12}\) or \(\frac{1}{4}\). The probability that she will ride a bike is equal to \(\frac{4}{12}\) or \(\frac{1}{3}\).
After determining these probabilities, students can perform a probability experiment to test the reasonableness of their answers using two spinners like the ones shown above. They can also place four different coloured tokens in a first bag and three different coloured tokens in a second bag. Each token in the first bag is associated with one of the four friends, and each token in the second bag is associated with one of the three activities. The experiment then consists of drawing one token from each bag and recording the results. Teachers should remind students of the importance of performing the experiment a sufficient number of times.
Note: Situations involving successive choices involve combinatorial thinking, which is emerging in the junior grades, so it is recommended that no more than two successive choices be made and that the number of possible outcomes be limited.
Source: translated from Guide d’enseignement efficace des mathématiques, de la 4e à la 6e année, Traitement des données et probabilité, p. 145-147.
Activity 2: Repeated Experiment
Present the students with a bag containing a red marble, a green marble, and a blue marble. The situation involves drawing a marble from the bag twice and noting its colour. Between the two draws, the marble must be put back in the bag. Ask students to determine the probability of obtaining:
- two red marbles;
- a red marble and a blue marble;
- two marbles of different colours.
This situation is similar to the situation with two successive choices presented earlier. The only difference is that both choices have the same possible outcomes. To solve the problem, students must list all nine possible equally likely outcomes. To do this, they can use:
a tree diagram;
image The tree diagram has two columns: first choice and second choice. Under first choice, three coloured chips are placed one below the other: one blue, one green and one red. From each of these, three branches unfold, each with a blue, a red and a green chip corresponding to the second choice. image The tree diagram has two columns: first choice and second choice. Under first choice, three coloured chips are placed one below the other: one blue, one green and one red. From each of these, three branches unfold, each with a blue, a red and a green chip corresponding to the second choice.
a table;
| Blue | Green | Red | |
|---|---|---|---|
| Blue | BB | BG | BR |
| Green | GB | GG | GR |
| Red | RB | RG | RR |
an ordered list.
Blue, blue
Blue, green
Blue, red
Green, blue
Green, green
Green, red
Red, blue
Red, green
Red, red
From these results, students can determine that the probability of getting:
- two red marbles is equal to \(\frac{1}{9}\);
- a red marble and a blue marble is equal to \(\frac{2}{9}\);
- two marbles of different colour is equal to \(\frac{6}{9}\).
Students should then have the opportunity to test the reasonableness of their answers by conducting a probability experiment.
Note that, in this situation, the result of the second draw does not depend on the result of the first. In mathematics, they are said to be independent results. This is another opportunity for students to understand the idea that chance has no memory.
Source: translated from Guide d’enseignement efficace des mathématiques, de la 4e à la 6e année, Traitement des données et probabilité, p. 147-149
Activity 3: Theoretical Probability
In the following instructional scenario, a probability situation is presented to illustrate how to support students in developing a better understanding of the concepts related to theoretical probability and to acquire a deeper probabilistic thinking. This activity also highlights a mistake that many people make when it comes to probability, namely, not considering all possible outcomes.
The two-Coloured Tokens Game
Form teams of three students and give each team two two-coloured tokens (for example, one green side and one red side). Then present the following situation:
Three students decide to play a game of tossing two two-coloured tokens. They agree beforehand that Student A wins if the outcome of the tosses is two green sides (  ) , Student B wins if the outcome is two red sides (
  ) and Student C wins if the outcome is two different colours (
  ). Do you think this game is fair?
A game is fair if the probability of winning is the same for each person.
Step 1: Taking a Stand
First, ask each student to tell the other members of his or her team whether or not he or she thinks the game is fair, without giving a reason.
Note: Asking students to take a stand at the beginning of the activity builds interest and engagement, as students will then tend to want to demonstrate that they are right, and if they are not, students will want to understand why. In addition, since students are likely to base their response on an intuitive understanding of probability, the teacher will have a good sense of their level of probabilistic thinking and will be able to assess the extent to which misconceptions about probability are present.
Ask each student to justify their choice to the other members of their team. For example, Student A might argue that the game is fair because each student has been assigned one of the three possible outcomes of throwing the two two-coloured tokens: R, R; R, G; or G, G. Students should discuss the arguments presented and try to agree on a common position for the team. Some students may be surprised that what they perceive to be self-evident may be perceived differently by others. This questioning goes a long way to changing some of the misconceptions in probability.
Step 2: Experience
Next, ask students to conduct an experiment to see if their team's position appears to be correct. Each team must toss the two tokens 10 times, record the results, and analyze them to see if they confirm or deny their position.
Prepare a table of results and have each team record their data on it. Here is an example of possible results.
Results of the Two-Coloured Tokens Tosses
| Team | Red, Red | Green, Green | Red, Green |
|---|---|---|---|
| team 1 | 3 | 3 | 4 |
| team 2 | 5 | 0 | 5 |
| team 3 | 2 | 2 | 6 |
| team 4 | 3 | 2 | 5 |
| team 5 | 1 | 3 | 6 |
| team 6 | 3 | 4 | 3 |
| team 7 | 2 | 0 | 8 |
| team 8 | 1 | 2 | 7 |
| team 9 | 5 | 2 | 3 |
| team 10 | 2 | 4 | 4 |
Facilitate a discussion about the results presented in the table by asking questions such as:
- Have any teams changed their initial stand on whether or not the game is fair after seeing of the results? If so, why?
Note: Given the small number of trials, it is quite possible that one team's position is the correct one, but that the results of the experiment suggest otherwise.
- What do you see when you compare the results of the different teams? (There is a lot of variability in the results.)
- Based on the results, which teams might conclude that the game is fair? That the game is not fair?
Then discuss with students how difficult it is for each team to draw conclusions from only 10 trials. To increase the reliability of the conclusions, suggest that students consider all the results from all the teams. Summing the results in each column yields the following table.
Results of the Two-Coloured Tokens Tosses
| Red, Red | Green, Green | Red, Green | |
|---|---|---|---|
| Total of 100 trials | 27 | 22 | 51 |
Encourage students to analyze this data by asking questions such as:
- What do you see about the number of R,R and G,G results? (The number of R,R results is very similar to the number of G,G results)
- What do you see about the number of R, G results? (It is significantly higher than the number of R,R results and the number of G,G results. In fact, it is almost equal to the sum of the R,R and G,G results.)
- What does this data seem to indicate about the game? Why? (The data seem to indicate that the game is not fair because Student C seems to have a higher probability of winning than the other two students.)
- If we did 100 more trials, is it possible that the data would lead us to believe that the game is fair? (If we take into account the variability of the results obtained by each team, this is indeed possible.)
Step 3: Theory
Emphasize to students that it would be important to find another way to determine if the game is fair or not. Suggest that students analyze more carefully the possible outcomes of throwing two two-coloured tokens. To facilitate this analysis, write the number 1 on both sides of the first token and the number 2 on both sides of the second token. Then explain that if the first token is tossed, there are two possible outcomes, either a green side or a red side, and that these two outcomes are equally likely. Then, following each of these two outcomes, a green side or a red side can also be obtained with the tossing of the second token. The results of the tosses of both tokens can be represented in the following tree diagram or table.
image Tree diagram. First choice: one green chip; second choice: one green chip, one red chip. First choice: one red chip; second choice: one green chip, one red chip.Table: The first row of the table is named "First Green Chip" and the second row is named "First Red Chip". The first column is named "Second green chip" and the second column is named "Second red chip". In the box corresponding to the first green chip and the second green chip, there are two green chips. In the box corresponding to the first green chip and the second red chip, there is one green chip and one red chip. In the box corresponding to the first red chip and the second green chip, there is a red chip and a green chip. And in the box corresponding to the first red chip and the second red chip, there are two red chips.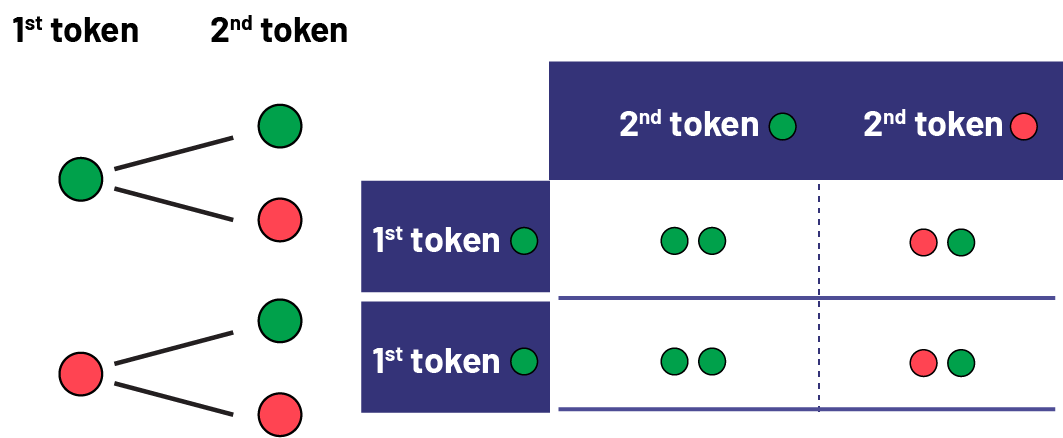
Looking at these results, we see that there is one way to get two green tokens, one way to get two red tokens, and two ways to get two different-coloured tokens. Therefore, the probability of getting two tokens of a different colour is greater than the probability of getting two red tokens or the probability of getting two green tokens, confirming that the proposed game is not fair.
We can also observe that there are two ways to get two different-coloured tokens (G, R and R, G) and two ways to get two tokens of the same colour (R, R and G, G). The probability of getting two different colours is therefore equal to the probability of getting the same colour. The results of the 100 trials presented in the table above illustrate these probabilities quite well (51 R, G or G, R results and 49 R, R or G, G results).
Ask students if the conclusions would be different in a situation where the same two-coloured token is tossed twice. The goal is to have students recognize that the two situations are the same, since they are independent outcomes, in other words, the outcome of the second toss does not depend on the outcome of the first toss. Therefore, there is no difference in the possibilities between two successive tosses of a single token or a single toss of two tokens.
Note: Many students have difficulty accepting that their initial take is not correct, even when a theoretical explanation is provided. To help them, it is important to expose them to a variety of probability experiments.
Source: translated from Guide d’enseignement efficace des mathématiques, de la 4e à la 6e année, Traitement des données et probabilité, p. 151-155.