D2. Probability:
D2. Describe the probability of events occurring and use this information to make predictions.
Learning Situation: Picking Up Cubes!
Total time: approximately 2 hours
Determine and compare theoretical and experimental probabilities using independent events and dependent events by drawing cubes from a container at random.
| Learning Expectations and Content |
|---|
|
Social-Emotional Learning in Mathematics and Mathematical Processes A1. Apply, to the best of their ability, a variety of social-emotional learning skills to support their use of the mathematical processes and their learning in connection with the expectations in the other five strands of the mathematics curriculum. In this lesson, to the best of their ability, students will learn to develop self-awareness and a sense of identity and to think critically and creatively as they apply the mathematical processes reflecting (demonstrating that they take time to think, consider previous experiences, and follow up on their thinking to help clarify their understanding as they solve problems) and representing (selecting and creating various representations of mathematical ideas and applying them to problem solving) so they can see themselves as capable math learners, and strengthen their sense of ownership of their learning, as part of their emerging sense of identity and belonging, and make connections between math and everyday contexts to help them to make informed judgements and decisions. Data Describe the likelihood that events will happen, and use that information to make predictions. D2.1 Describe the difference between independent and dependent events, and explain how their probabilities differ, providing examples. D2.2 determine and compare the theoretical and experimental probabilities of two independent events happening and of two dependent events happening. |
Present the following situation:
a) Using two different strategies (one of which is the tree diagram), represent the theoretical probabilities of the following two events:
- the first cube is put back in the container before drawing another one (independent events);
- the first cube is kept before drawing another one (dependent events).
Some strategies the student can use to solve the problem include:
Strategy 1 - Tree Diagram
I list all the possibilities, following two consecutive draws, in a tree diagram regarding the independent events and the dependent events.
 Image
“Independent, with return. The likelihood of consecutively drawing two red cubes when the first is returned in the
container is 9 out of 49 or 0.184 or 18.4%.” The tree diagram shows the following scenarios. If the first draw has
"blue cube two chances out of seven", and the second draw has "blue cube two chances out of seven", the result is:
blue cube two chances out of seven multiplied by blue cube two chances out of seven equals four chances out of 49.
If the second draw has "red cube three chances out of seven", the result is: blue cube two chances out of seven
multiplied by red cube three chances out of seven equals six chances out of 49. If the second draw has "green cube
two chances out of seven", the result is: blue cube two chances out of seven multiplied by green cube two chances
out of seven equals 4 chances out of 49. If the first draw has "red cube three chances out of seven", and the second
draw has "blue cube two chances out of seven", the result is: red cube three out of seven multiplied by blue cube
three out of seven equals six chances out of 49. If on the second draw we have "red cube three chances out of
seven", the result is: red cube three chances out of seven multiplied by red cube three chances out of seven, equals
9 chances out of 49. This equation is the only one highlighted in purple. If the second draw has "green cube two
chances out of seven", the result is: red cube three chances out of seven multiplied by green cube two chances out
of seven equals 6 chances out of 49. If the first draw has "green cube two chances out of seven", and the second
draw has "blue cube two chances out of seven", the result is: green cube two chances out of seven multiplied by blue
cube two chances out of seven equals four chances out of 49. If the second draw has "red cube three chances out of
seven", the result is: green cube two chances out of seven multiplied by red cube three chances out of seven equals
six chances out of 49. If the second draw has "green cube two chances out of seven", the result is: green cube two
chances out of seven multiplied by green cube two chances out of seven equals four chances out of 49.
Image
“Independent, with return. The likelihood of consecutively drawing two red cubes when the first is returned in the
container is 9 out of 49 or 0.184 or 18.4%.” The tree diagram shows the following scenarios. If the first draw has
"blue cube two chances out of seven", and the second draw has "blue cube two chances out of seven", the result is:
blue cube two chances out of seven multiplied by blue cube two chances out of seven equals four chances out of 49.
If the second draw has "red cube three chances out of seven", the result is: blue cube two chances out of seven
multiplied by red cube three chances out of seven equals six chances out of 49. If the second draw has "green cube
two chances out of seven", the result is: blue cube two chances out of seven multiplied by green cube two chances
out of seven equals 4 chances out of 49. If the first draw has "red cube three chances out of seven", and the second
draw has "blue cube two chances out of seven", the result is: red cube three out of seven multiplied by blue cube
three out of seven equals six chances out of 49. If on the second draw we have "red cube three chances out of
seven", the result is: red cube three chances out of seven multiplied by red cube three chances out of seven, equals
9 chances out of 49. This equation is the only one highlighted in purple. If the second draw has "green cube two
chances out of seven", the result is: red cube three chances out of seven multiplied by green cube two chances out
of seven equals 6 chances out of 49. If the first draw has "green cube two chances out of seven", and the second
draw has "blue cube two chances out of seven", the result is: green cube two chances out of seven multiplied by blue
cube two chances out of seven equals four chances out of 49. If the second draw has "red cube three chances out of
seven", the result is: green cube two chances out of seven multiplied by red cube three chances out of seven equals
six chances out of 49. If the second draw has "green cube two chances out of seven", the result is: green cube two
chances out of seven multiplied by green cube two chances out of seven equals four chances out of 49. 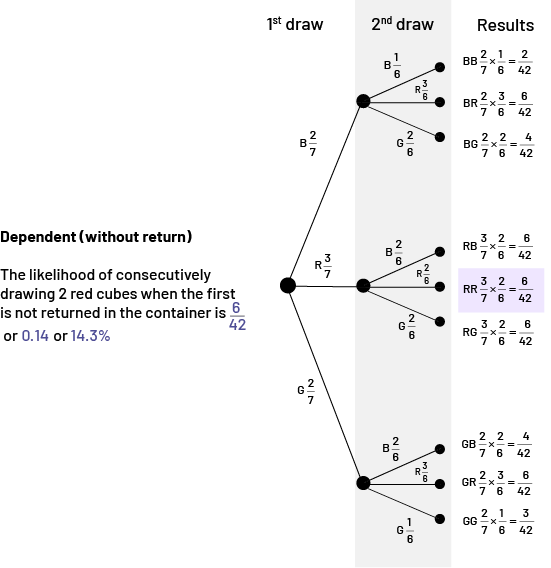 Image
“Dependent, without return. The likelihood of consecutively drawing 2 red cubes when the first is returned in the
container is 9 out of 49 or 0.184 or 18.4%.” The tree diagram shows the following scenarios. If the first draw has
"blue cube two chances out of seven", and the second draw has "blue cube one chance out of six", the result is: blue
cube two chances out of seven multiplied by blue cube one chance out of six equals two chances out of 42. If the
second draw has "red cube three chances out of six", the result is: blue cube two chances out of seven multiplied by
red cube three chances out of six equals six chances out of 42. If the second draw has "green cube two chances out
of six", the result is: blue cube two chances out of seven multiplied by green cube two chances out of six equals
four chances out of 42. If the first draw has "red cube three chances out of seven", and the second draw has "blue
cube two chances out of six", the result is: red cube three chances out of seven multiplied by blue cube two chances
out of six equals six chances out of 42. If the second draw has "red cube two chances out of six", the result is:
red cube three chances out of seven multiplied by red cube two chances out of six equals six out of 42. This result
is the only one highlighted in purple. If the second draw has "green cube two chances out of six", the result is:
red cube three chances out of seven multiplied by green cube two chances out of six equals six chances out of 42. If
the first draw has "green cube two chances out of seven", and the second draw has "blue cube two chance out of six",
the result is: green cube two chances out of seven multiplied by blue cube two chances out of six is four chances
out of 42. If the second draw has "red cube three chances out of six", the result is: green cube two chances out of
seven multiplied by red cube three chances out of six equals six chances out of 42. If the second draw has "green
cube one chance out of six", the result is: green cube two chances out of seven multiplied by green cube one chance
out of six equals three chances out of 42.
Image
“Dependent, without return. The likelihood of consecutively drawing 2 red cubes when the first is returned in the
container is 9 out of 49 or 0.184 or 18.4%.” The tree diagram shows the following scenarios. If the first draw has
"blue cube two chances out of seven", and the second draw has "blue cube one chance out of six", the result is: blue
cube two chances out of seven multiplied by blue cube one chance out of six equals two chances out of 42. If the
second draw has "red cube three chances out of six", the result is: blue cube two chances out of seven multiplied by
red cube three chances out of six equals six chances out of 42. If the second draw has "green cube two chances out
of six", the result is: blue cube two chances out of seven multiplied by green cube two chances out of six equals
four chances out of 42. If the first draw has "red cube three chances out of seven", and the second draw has "blue
cube two chances out of six", the result is: red cube three chances out of seven multiplied by blue cube two chances
out of six equals six chances out of 42. If the second draw has "red cube two chances out of six", the result is:
red cube three chances out of seven multiplied by red cube two chances out of six equals six out of 42. This result
is the only one highlighted in purple. If the second draw has "green cube two chances out of six", the result is:
red cube three chances out of seven multiplied by green cube two chances out of six equals six chances out of 42. If
the first draw has "green cube two chances out of seven", and the second draw has "blue cube two chance out of six",
the result is: green cube two chances out of seven multiplied by blue cube two chances out of six is four chances
out of 42. If the second draw has "red cube three chances out of six", the result is: green cube two chances out of
seven multiplied by red cube three chances out of six equals six chances out of 42. If the second draw has "green
cube one chance out of six", the result is: green cube two chances out of seven multiplied by green cube one chance
out of six equals three chances out of 42.
Strategy 2 - Probability Table
I list all the probabilities in a probability table.
 Image “Independent, with return. The likelihood of consecutively drawing 2 red cubes when the
first is returned in
the container is 9 out of 49 or 0.184 or 18.4%.” The table illustrates the possible combinations when drawing two
cubes in a container that has two blue cubes, three red cubes and two green cubes. The first letter of each color is
used to name them in the table: B, R and G. The columns are named as follows: B, B, R, R, R, G, G.. The rows are
named as follows: B, B, R, R, R, G. G. Each box where the row meets the column is labeled with the two corresponding
letters. The 9 boxes where the combination R R is found are grouped in the middle of the table.
image “Dependent, without return. The likelihood of consecutively drawing 2 red cubes when the
first is returned in
the container is 9 out of 49 or 0.184 or 18.4%.” The table illustrates the possible combinations when drawing two
cubes in a container that has two blue cubes, three red cubes and two green cubes. The first letter of each color is
used to name them in the table: B, R and G. The columns are named as follows: B, B, R, R, R, G, G.. The rows are
named as follows: B, B, R, R, G, G. The third row of the table is made up of empty boxes. Each box where the row
meets the column shows the two corresponding letters. The six boxes where the combination R R is found are grouped
towards the center of the table, under the row of empty boxes.
Image “Independent, with return. The likelihood of consecutively drawing 2 red cubes when the
first is returned in
the container is 9 out of 49 or 0.184 or 18.4%.” The table illustrates the possible combinations when drawing two
cubes in a container that has two blue cubes, three red cubes and two green cubes. The first letter of each color is
used to name them in the table: B, R and G. The columns are named as follows: B, B, R, R, R, G, G.. The rows are
named as follows: B, B, R, R, R, G. G. Each box where the row meets the column is labeled with the two corresponding
letters. The 9 boxes where the combination R R is found are grouped in the middle of the table.
image “Dependent, without return. The likelihood of consecutively drawing 2 red cubes when the
first is returned in
the container is 9 out of 49 or 0.184 or 18.4%.” The table illustrates the possible combinations when drawing two
cubes in a container that has two blue cubes, three red cubes and two green cubes. The first letter of each color is
used to name them in the table: B, R and G. The columns are named as follows: B, B, R, R, R, G, G.. The rows are
named as follows: B, B, R, R, G, G. The third row of the table is made up of empty boxes. Each box where the row
meets the column shows the two corresponding letters. The six boxes where the combination R R is found are grouped
towards the center of the table, under the row of empty boxes.
b) Determine the experimental probabilities of the two events after 10 trials and then after 20 trials to compare with the theoretical probabilities listed in (a).
Strategy
I now perform both experiments (with and without putting the first cube back into the container) according to the number of trials requested.
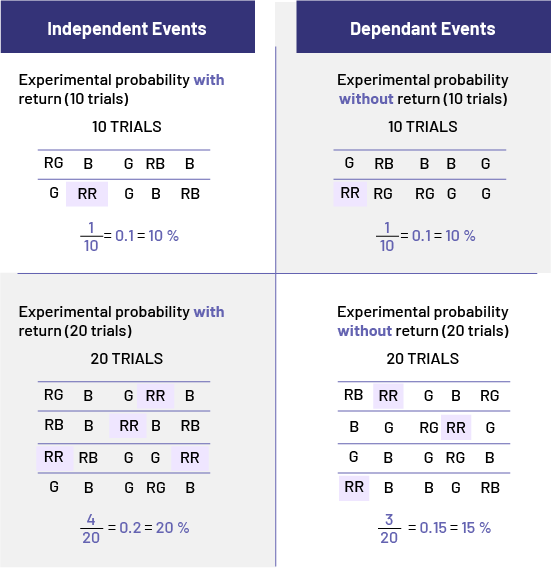 Image Independent events Experimental chance with return, ten tries. First row: RG, B, G, RB, B.
Second row: G, RR,
B, RB. The RR combination is highlighted in purple. One out of ten equals zero point one equals ten percent. Dependent
events Experimental chance without return, ten tries. First row: G, RB, B, B, G. Second row: RR, RG, RG, G,
G. The RR combination is highlighted in purple. One out of ten equals zero point one equals ten percent. Experimental
chance with return, twenty tries. First row. RG, B, G, RR. B. Second row: RB, B, RR, B, RB. Third row:
RR, RB, G, G, RR. Fourth row: G, B, G, RG, B. All RR combinations are highlighted in purple. Four out of twenty equals
zero point two equals twenty percent. Experimental chance with return, twenty tries. First row: RB, RR, G, B, RG.
Second row : B, G, RG, RR, G. Third row:
G, B, G, RG, B. Fourth row: B, B, G, RB. All RR combinations are highlighted in purple. Three out of twenty equals
zero point fifteen equals fifteen percent. In the 10 trials, I don't see a difference between the experimental
probabilities of the independent and dependent
events, even though, in theory, I know there should be one. This is an experiment, and the results are random.
However, I do see the difference between the experimental probabilities of the independent and dependent events when I
run 20 trials. With more trials, the experimental results come closer to the theoretical probabilities.
Image Independent events Experimental chance with return, ten tries. First row: RG, B, G, RB, B.
Second row: G, RR,
B, RB. The RR combination is highlighted in purple. One out of ten equals zero point one equals ten percent. Dependent
events Experimental chance without return, ten tries. First row: G, RB, B, B, G. Second row: RR, RG, RG, G,
G. The RR combination is highlighted in purple. One out of ten equals zero point one equals ten percent. Experimental
chance with return, twenty tries. First row. RG, B, G, RR. B. Second row: RB, B, RR, B, RB. Third row:
RR, RB, G, G, RR. Fourth row: G, B, G, RG, B. All RR combinations are highlighted in purple. Four out of twenty equals
zero point two equals twenty percent. Experimental chance with return, twenty tries. First row: RB, RR, G, B, RG.
Second row : B, G, RG, RR, G. Third row:
G, B, G, RG, B. Fourth row: B, B, G, RB. All RR combinations are highlighted in purple. Three out of twenty equals
zero point fifteen equals fifteen percent. In the 10 trials, I don't see a difference between the experimental
probabilities of the independent and dependent
events, even though, in theory, I know there should be one. This is an experiment, and the results are random.
However, I do see the difference between the experimental probabilities of the independent and dependent events when I
run 20 trials. With more trials, the experimental results come closer to the theoretical probabilities.
Source: translated from En avant, les maths!, 7e année, CM, Données, p. 4-8.