D1.2 Collect qualitative data and discrete and continuous quantitative data to answer questions of interest, and organize the sets of data as appropriate, including using percentages.
Skill: Formulating and Answering Questions of Interest
In planning their inquiry or probability experiment, students should first ensure that they have a clear understanding of the situation. This can be done by clarifying the problem and formulating one or more questions that can be answered with data. They should also consider, as much as possible, some of the factors may be variable, and that these may affect the outcome of the inquiry or experiment.
Clarify the Problem
Before solving a situational problem, educators must ensure that the problem is clearly understood by all the students. They can check this understanding and, if necessary, help them clarify the problem by facilitating an exchange of ideas about the situation.
Formulate Questions
Once students have a clear understanding of what they are looking for or would like to know, they can begin to plan the inquiry. The students must first clearly formulate the question of interest to clarify the intent of the inquiry. A question of interest is a question that can only be answered from variable data. So, "How many children are there in your family?" is not a question of interest, since the answer is fixed (for example, three children) and does not depend on variable data. However, "How many children per family are there among the students in the class group?" is a question of interest, since to answer it, it is first necessary to collect data relating to the number of children in each of the students' families. In the light of the answers obtained, it will then be possible to conclude, for example, that in the majority of the students’ families, there are two children.
Teachers need to help students understand the importance of getting the question of interest right and ensuring that it accurately reflects what they are looking for. Students should also learn to recognize that the choice of the question of interest affects the type of inquiry that should then be conducted. The following are some examples of questions of interest that students might address. Each question is accompanied by the type of inquiry it suggests.
| Question of Interest | Type of Inquiry |
|---|---|
| What are the three favourite varieties of apples in Ms. Pomerleau's class? | Survey |
| How many servings of vegetables and fruits do students in the class group eat in a day? | Observations |
| What is the height of the students in the class? | Measurements |
| How many bounces does a table tennis ball make when dropped from a height of one meter? | Scientific experiment |
| If a Styrofoam cup is dropped, is it more likely to land upright, upside down, or sideways? | Probability experiment |
| Which month of the year has the most precipitation? | Secondary data collection |
Source: translated from Guide d’enseignement efficace des mathématiques de la 1re à la 3e année, Traitement des données et probabilité, p. 59-61.
Skill: Collecting Data
Planning a data collection and carrying it out provides authentic and meaningful data.
The inquiry process is a comprehensive one that involves four steps: identifying the situation, collecting the data, organizing the data, and interpreting the results.
Once students have clarified the problem and formulated one or more questions of interest, they should plan and conduct a data collection. It is important to consider the different types of inquiry, the different kinds of data, and the difference between population and sample when planning data collection. By actively involving students in planning data collection, it encourages them to make thoughtful choices and look critically at the entire inquiry process.
Source: translated from Guide d’enseignement efficace des mathématiques, de la 4e à la 6e année, Traitement des données et probabilité, p. 44.
Questions to Ask
It is important to provide students with a variety of opportunities to plan a data collection. By asking students questions throughout this stage, teachers help them to understand the importance of choosing the right type of inquiry and data for the question of interest, and then to identify the population and, if necessary, the sample to be surveyed. In doing so, teachers help students to develop critical thinking skills, which will be very useful in the fourth stage of the inquiry process.
Here are some ideas for questions that teachers can use to guide students through the planning of data collection.
Type of Inquiry:
What type of inquiry is most appropriate for your question of interest? Why?
Type of Data:
- What kind of data will you collect?
- Does this kind of data lend itself well to your question of interest? Why or why not?
- If you are going to use secondary data, where will it come from? Is this source reliable?
Target Population:
- What is your target population?
- Is this the group that your inquiry is targeting?
- Will your inquiry be conducted with the entire population or only a portion of the population?
Sample Size:
- What will your sample size be? How did you determine it?
- With a sample of this size, will the results be representative of the target population? Why or why not?
- Do you think the results would be similar if the sample size were smaller? larger? why?
Sample Composition:
- Is the sample composition free of bias? Convince me.
- How will you go about selecting your sample at random?
- Does your sample need to be stratified? Why or why not?
- What strata will you use in the composition of your sample? What will be the size of each stratum?
Modalities (Where, When, How):
- Where will you conduct your inquiry?
- When will you conduct your inquiry? Why is this a good time? If it were conducted at another time, would the results be the same?
- How will you go about getting the data you need?
- How will you record the results of your inquiry?
Source: translated from Guide d’enseignement efficace des mathématiques, de la 4e à la 6e année, Traitement des données et probabilité, p. 57-58.
Skill: Organizing Data
Organizing data and representing it in tables and graphs helps communicate information for interpretation. Once students have identified the situation and collected data, they must organize it.
Why Organize Data
Gal (2002) indicates that we organize the data to better analyze it or to communicate information. Since the purpose of the inquiry is to find an answer to one or more questions of interest, it is very difficult to base that answer on data that is presented in a disorganized fashion. By organizing the data collected, it can be presented in a way that summarizes it, highlights certain information, communicates its main characteristics, and facilitates its interpretation.
Source: translated from Guide d’enseignement efficace des mathématiques, de la 4e à la 6e année, Traitement des données et probabilité, p. 62.
Knowledge: Types of Inquiry
Data Collection by Observations
In a data collection by observations, we record what we see or do.
Examples
- We count the number of birds we see in the schoolyard at specific times.
- We count the number of cars that pass through an intersection during a given time interval.
- We count the number of times we go to the sports centre in a month.
- Every day, for a week, we note the time we go to bed and the time we get up.
In planning data collection by observations, it is necessary to consider where, when, what, and sometimes how to observe; for example, how to distinguish between a car that makes an incomplete stop at an intersection and a car that makes no stop at all. It is also important to determine whether all observations will be made by one person or by several people at the same time to ensure greater reliability.
Data Collection by Measurements
In a data collection by measurements, we make simple measurements in situations that do not require special attention to various variables, as is the case in an experiment.
Examples
- We measure the amount of time required for Grade 7 students to read a given text.
- We measure the amount of rain (in mm) that falls each day in May.
In planning data collection by measurements, it is important to consider where, when and how to collect the measurements, and whether all measurements will be collected by one person or by several people at the same time to ensure greater reliability.
Data Collection by Means of an Experiment
In data collection by means of an experiment, the data are derived from scientific activity that requires adherence to certain preset parameters and, often, the use of precise measurement techniques and tools.
Examples
- At specific intervals, plants are measured for growth, with some receiving a small amount of nutrients, some receiving a larger amount, and some receiving no nutrients, to see if nutrients are contributing significantly to plant growth.
- Every 30 seconds, the temperature is taken of any liquid that has been heated to 100°C and left to cool. The experiment is repeated with various liquids in order to compare the rate at which they cool.
In planning data collection by means of an experiment, the scientific approach must be used and the reliability of the data collection method must be ensured. Variables that may render the results invalid must be controlled and neutralized.
Survey
In a survey, data is collected by asking a number of individuals about a particular topic. The questions often take the form of a questionnaire that can be answered in writing or orally.
Examples
- Students in the class are asked how many hours they spend watching television each week.
- We ask Grade 7 students what kind of music they prefer.
In planning a survey, it is important to carefully formulate the survey questions to ensure that they are clear and objective. It is also important to determine the responses that can be given and sometimes group them into categories.
Secondary Data Collection
When gathering existing data, the data is usually found in an electronic database such as a website, or in a printed document such as a book, magazine, or encyclopedia.
Examples
- We want to compare the population of Canada's provinces and territories.
- We want to compare the subject preferences of junior students to intermediate students across Canada.
When planning secondary data collection, it is important to check whether the data are available, where and how to obtain them, and to ensure that the source is reliable.
Source: translated from Guide d’enseignement efficace des mathématiques, de la 4e à la 6e année, Traitement des données et probabilité, p. 46-48.
Knowledge: Sampling Techniques
Selection Process
Simple Random Sampling
Students should understand that one of the best ways to have a good bias-free sample is to choose it randomly, that is, so that all individuals have an equal chance of being included.
Source: translated from Guide d’enseignement efficace des mathématiques, de la 4e à la 6e année, Traitement des données et probabilité, p. 55.
Systematic Random Sampling
Systematic random sampling is used when the subjects in a population are selected using a systematic approach that has been randomly determined. A sample, for example, could be determined using an alphabetical list of names, using a starting name and count (for example, every fourth name) that are randomly selected.
Source: Ontario Curriculum, Mathematics Curriculum Grades 1-8, 2020, Ontario Ministry of Education.
Stratification Process
In some inquiries, we may want to ensure that certain subgroups of the population are well represented in the sample; for example, the junior and intermediate subgroups. The population is therefore stratified, in other words, it is divided into mutually exclusive groups. Each stratum (group) must be represented in the sample.
Source: translated from Guide d’enseignement efficace des mathématiques, de la 4e à la 6e année, Traitement des données et probabilité, p. 56.
Stratified Random Sampling
Stratified random sampling involves dividing the population into strata and then taking a random sample from each stratum; for example, a school population could be divided into two sub-populations (strata): one with students who take the bus to school and one with those who do not. A survey could then be conducted with 10% of the randomly selected population in each of these strata.
Source: Ontario Curriculum, Mathematics Curriculum Grades 1-8, 2020, Ontario Ministry of Education.
Knowledge: Type of Data
There are many different types of data, and each can affect how it is collected and organized. In the junior grades, students need to understand the difference between qualitative and quantitative data, as well as between primary and secondary data. This understanding ensures that they can determine the type of data they will use for the purpose of the inquiry and plan their collection accordingly.
Qualitative and Quantitative Data
Qualitative data are represented by words; for example, if, to determine the distribution of junior students' birthdays by season, we proceed by asking the question "What season is your birthday?" the four qualitative responses would be spring, summer, fall , or winter. To the question "What are your favorite hobbies?" the responses should be names of activities; in this case, however, if we determine too many different responses because of the variety of possible activities, we can use categories, such as cultural, athletic, or recreational activities. Qualitative data are often represented by a bar graph, and in the intermediate grades, more likely to be represented by a circle graph.
Example
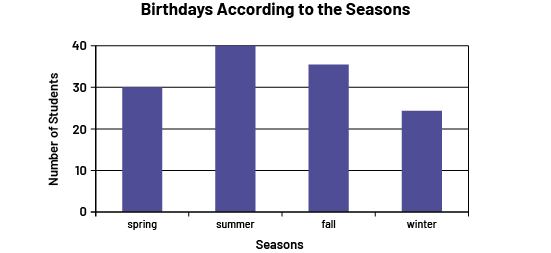 Image A 4-bar chart is titled "Birthdays According to the Seasons". The horizontal axis is named "Seasons," and the vertical axis is named "Number of Students". In spring, the bar goes up to 3. In summer, the bar goes up to 8. In the fall, the bar goes up to 7. And in the winter, the bar goes up to two.
 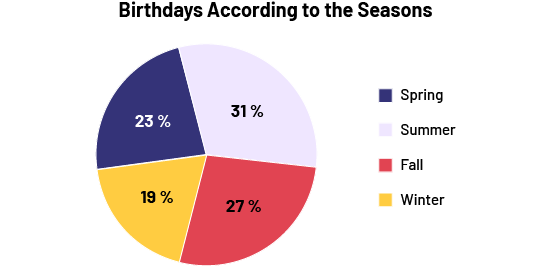 Image The pie chart is titled Birthdays According to the Seasons ". It is divided into four parts: Spring, at 23 percent; Summer, at 31 percent; Fall, at 27 percent; and Winter, at 19 percent.
 Quantitative data are represented by numbers; for example, to the question, "How tall is the plant at the end of each week?" the answer should be quantitative, for example, 5 cm, 15 cm. If we determine too many different answers, we can use scales; for example, if we are measuring the length of the feet of the students in the class group, we can group the data according to scales of 15 cm to 15.9 cm or 16 cm to 16.9 cm. Quantitative data are often represented by a broken-line graph or a stem-and-leaf plot.
Example
 Image The broken line diagram is called "Growth of a Plant". The horizontal axis is called "Number of weeks" and is graduated from zero to five. The vertical axis is called "Height in centimeters" and is graduated from zero to 25. The first dot is located at zero on the horizontal axis and at five on the vertical axis. The second dot is located at one on the horizontal axis and between five and ten on the vertical axis. The third dot is located at two on the horizontal axis and between ten and 15 on the vertical axis. The fourth dot is located at three on the horizontal axis and between 15 and 20 on the vertical axis. The fifth dot is located at four on the horizontal axis and 20 on the vertical axis. And the sixth dot is located at five on the horizontal axis and slightly above 20 on the vertical axis.
Length, in Centimetres, of Grade 7 Students' Feet
| 15. | 7 8 8 9 |
| 16. | 3 5 6 7 7 9 |
| 17. | 0 3 6 7 8 8 9 |
| 18. | 0 0 1 3 3 3 5 6 6 9 9 |
| 19. | 1 2 2 4 4 4 4 5 |
| 20. | 1 2 4 4 5 |
| 21. | 1 3 |
Source: translated from Guide d’enseignement efficace des mathématiques, de la 4e à la 6e année, Traitement des données et probabilité, p. 49-50.
Quantitative data can be discrete or continuous.
Discrete Data
Data that can be counted.
Example
The number of tickets sold for soccer games.
Continuous Data
Data that can take any value within a chosen scale.
Example
The speed of an athlete in a 200 m race or the temperature of the water on the stove.
Source: translated from En avant, les maths!, 7e année, CM, Données, p. 2.
Primary and Secondary Data
Primary data is data collected by the person conducting the inquiry. It is well-suited to questions that involve objects and people in the students' immediate environment, and is ideal for introducing students to data management, since they are usually more interested in the data they have collected themselves. Once students are familiar with the possible answers, they can facilitate the recording of data by using a frequency table.
Secondary data is data collected by an individual or organization, such as a researcher, company or association, other than the person conducting the inquiry. This data can be found in books, encyclopedias, magazines, newspapers and on the Internet. It is particularly useful for answering questions of interest for which it is difficult or impossible to collect primary data; for example, "Over the years, how large was the French-speaking population in Canada's major cities? It can also be used to interpret other data with which it is related to. Students should be able to decide, depending on the type of inquiry and the nature of the question of interest, whether to use primary data or secondary data.
Since students are exposed to secondary data on a daily basis, teachers should help students develop the ability to judge its reliability, validity, and relevance. In order to do so, teachers must continually raise student awareness of the importance of verifying the reliability, validity, and relevance of the data they encounter.
Source: translated from Guide d’enseignement efficace des mathématiques, de la 4e à la 6e année, Traitement des données et probabilité, p. 50-52.
Knowledge: Question of Interest
After identifying the situation and determining something that needs to be clarified or a direction that needs to be taken, students move on to formulating different questions of interest. This helps students recognize the importance of asking good questions that are focused on the proposed situation.
Konold and Higgins (2001) argue that the first challenge for students is to turn a question into a question of interest. According to the Guidelines for Assessment and Instruction in Statistics Education (GAISE) Report ( (Franklin et al., 2005), formulating a question of interest requires an understanding of the difference between a question that predicts a deterministic answer and another that provides a response based on variable data; for example, the question "What is the colour of your hair?" is not a question of interest, since it requires a precise answer. However, the question "What is the hair colour of the students in the class group?" is a question of interest, since it requires an answer that will vary according to the data obtained. A question of interest must therefore lead to the collection of relevant data, the recording of this data and the creation of tools to interpret it.
Formulating questions of interest helps to clarify the intent of the inquiry and the type of inquiry that will follow. In the case of a survey, it also helps to develop the specific, objective question(s) that will be asked.
Purpose of the Inquiry
Inquiry intent usually emerges from the process of formulating the questions of interest. In fact, the questions of interest and the inquiry intent run in parallel, as the questions reflect the intent. Chapin et al. (2002) describe four possible intents:
- describe or summarize a set of data;
- determine preferences or opinions based on a set of data;
- compare two sets of data;
- generalize from the data collected and make predictions.
The following are examples of keywords and questions of interest that are consistent with each of these intentions.
Describe or Summarize a Data Set
Key words:
What or which…?
How much…?
Which one…?
Examples of questions of interest:
- What font size is used in the books in the library's mystery section?
- How many cars make a complete stop at the corner?
- Which of the Grade 7 classes read the most books last month?
Determine Preferences or Opinions From a Data Set
Key words:
What are… favourites?
What is the worst…? the best…?
Examples of questions of interest:
- What are the middle school students' favourite music groups?
- What qualities do students look for in a friend?
- What is the best way to improve your math scores?
Compare Two Data Sets
Key words:
What are the similarities between…?
Is there a relationship between… and…?
Which… is better? more? less?
Examples of questions of interest:
- What are the similarities and differences between the sports played by Grade 6 students and those played by Grade 7 students?
- Is there a relationship between the number of hours of sunlight and the growth of a tomato plant?
- Which ball bounces better? The tennis ball or the table tennis ball?
Generalize From the Data Collected and Make Predictions
Key words:
Can we predict…?
What will…be?
Examples of questions of interest:
- What will be the population of our city in five years?
Survey Questions
Depending on the students' experience and grade, teachers should provide more or less help in formulating survey questions. It should lead the students to understand the importance of ensuring that these questions are compatible with the question of interest and the intention of the inquiry; for example, a survey question like "How many sports do you play?" is inconsistent with the question of interest "What are the similarities and differences between the sports played by Grade 6 students and those played by Grade 7 students?" ". Students should recognize that one survey question can generate a large number of different responses, making it more difficult to collect, record, and interpret data. In such cases, they must learn to phrase the question in such a way that it offers a limited number of answers, such as a multiple-choice question or a question with a scale.
Examples
- In which country were your parents born?
This question can generate a wide variety of responses. In some settings, there may even be as many responses as there are people who took the survey.
Note: You could, however, choose to keep the question, but record the responses under a limited number of categories; for example, by continent.
- Which of the following sports activities do you prefer?
- Gymnastics
- Badminton
- Soccer
- Hockey
- None
This multiple-choice question presents a limited number of responses from which survey respondents must choose, making it easier to organize and analyze the data.
- Would you like to visit a country other than Canada?
- Not at all
- A little
- Very Much
This scaled question is intended to help survey respondents place their preference or evaluation on a continuum according to established categories, making it easier to organize and analyze the data. When formulating survey questions, it is important to encourage students to draw on their personal experiences to think about the range of possible interpretations and responses to their question, as well as the importance of the words used. In some cases, teachers may suggest that they test their question with a group of respondents to get a sample of responses. This will allow them to see if the question generates the kind of response they would expect, and if the response is such that they will find it relatively simple to organize and interpret. Depending on the results, they may decide to either go ahead with the survey, or to rephrase the question.
In some situations, students are required to write a survey questionnaire with more than one question in order to collect data that will later be analyzed, aggregated, compared, and interpreted.
The wording of a survey question and the choice of suggested answers can affect the data collected and the results of the survey. This is called bias. A biased question lacks the objectivity required to ensure reliable results. Teachers need to help students understand the concept of bias and recognize it in the wording of a question; for example, all of the questions below are more or less biased because they either clearly state or imply that there are not enough balls for recess activities.
Examples of Biased Survey Questions
- Don't you think that there is a lack of balls to play with at recess?
- Many middle school students believe that there are not enough balls for recess activities. Do you agree?
- Do you think that there is a lack of balls for recess activities and that the principal should take action to address the problem?
- The school will purchase 15 balls for recess activities. How many balls should the school buy so that there are enough?
In this situation, an objective or unbiased question might be:
- Are there enough balls available for recess activities?
What is a Bias?
A bias in a survey is a type of error that favours or disfavours a particular response and causes the survey results to be unreliable.
Source: translated from Guide d’enseignement efficace des mathématiques, de la 4e à la 6e année, Traitement des données et probabilité, p. 32-37.
Knowledge: Relative-Frequency Table
A relative frequency table is an extension of a frequency table and shows each category expressed as a proportion of the total frequencies, represented using fractions, decimals, or percentages. The sum of the relative frequencies is 1 or 100%.
Source: Ontario Curriculum, Mathematics Curriculum Grades 1-8, 2020, Ontario Ministry of Education.
Example
The number of responses by category is expressed as a proportion of the total number of responses (600) as well as a percentage.
Type of News That Teens Read
| Type of News | Frequency | Relative Frequency (Fraction) | Relative Frequency (Decimal Number) | Relative Frequency (%) |
|---|---|---|---|---|
| Surveys | 59 | \(\frac{59}{600}\) | 0.10 | 10 % |
| Stock Markets | 9 | \(\frac{9}{600}\) | 0.02 | 2 % |
| Sports | 137 | \(\frac{137}{600}\) | 0.23 | 23 % |
| Events and culture | 122 | \(\frac{122}{600}\) | 0.20 | 20 % |
| World | 47 | \(\frac{47}{600}\) | 0.08 | 8 % |
| Health | 32 | \(\frac{32}{600}\) | 0.05 | 5 % |
| Science and Technology | 68 | \(\frac{68}{600}\) | 0.11 | 11 % |
| Environment | 31 | \(\frac{31}{600}\) | 0.05 | 5 % |
| Agriculture and food | 24 | \(\frac{24}{600}\) | 0.04 | 4 % |
| Businesses | 3 | \(\frac{3}{600}\) | 0.01 | 1 % |
| Regional News | 68 | \(\frac{68}{600}\) | 0.11 | 11 % |
| Total | 600 | \(\frac{600}{600}\) | 1 | 100 % |