D1.3 Select from among a variety of graphs, including circle graphs, the type of graph best suited to represent various sets of data; display the data in the graphs with proper sources, titles, and labels, and appropriate scales; and justify their choice of graphs.
Skill: Choosing the Appropriate Graph to Represent Various Sets of Data
Representing data in tables and graphs helps communicate information for interpretation.
Source: translated from Guide d’enseignement efficace des mathématiques, de la 4e à la 6e année, Traitement des données et probabilité, p. 62.
How to Organize Data
A variety of tables and graphs are commonly used in data management to represent sets of data clearly and to facilitate analysis. Each has its advantages as well as its limitations. It is important to note, however, that the construction of a table generally precedes the construction of a graph.
In the junior grades, students represent data using a variety of graphs, including multiple-bar graphs, stacked-bar graphs, histograms, and broken-line graphs. In Grade 7, the circle graph is added.
In the Intermediate Division, students choose from any of these representations.
Source: translated from Guide d’enseignement efficace des mathématiques, de la 4e à la 6e année, Traitement des données et probabilité, p. 66-67.
Once the data from a survey have been grouped into categories, in a frequency table or a similar representation, it is often very useful to represent it using a graph because of its visual appeal. Indeed, a graph:
- presents information in an organized manner;
- is generally easier to read and interpret than data represented using text or a table;
- allows you to see all the data at a glance and to get a first impression (for example whether or not the data is evenly or unevenly distributed between the categories);
- facilitates the next step in the inquiry process, which is the analysis of the data and interpretation of the results.
Source: translated from Guide d’enseignement efficace des mathématiques, de la maternelle à la 3e année, Traitement des données et probabilité, p. 86.
Skill: Representing Data Using Graphs
Once the data has been collected and recorded, students must group the data within a limited number of categories. There is no rule that dictates how to group the data. The choice of grouping depends, in large part, on the type of data being collected.
Source: translated from Guide d’enseignement efficace des mathématiques, de la maternelle à la 3e année, Traitement des données et probabilité, p. 81.
The order of the categories is important in graphs with quantitative data; numbers are placed in ascending order. In contrast, the order of the categories is not important in graphs with qualitative data; for example, the colours can be placed in any order.
The source, titles, labels, and scales provide important information about data in a graph:
- The source indicates where the data was collected.
- The title introduces the data contained in the graph.
- Labels provide additional information, such as the categories that are represented in the sectors of a circle graph. Percentages are often used in circle graphs to describe the categories.
- Scales identify the possible values of a variable along an axis of a graph. Values are arranged in ascending order on a scale.
Source: Ontario Curriculum, Mathematics Curriculum Grades 1-8, 2020, Ontario Ministry of Education.
Skill: Justifying Your Choice of Graph
In order to target the best representation for the data collected, students need to understand the characteristics and purposes of different types of graphs to select the best way to represent a data set. While data can be visualized using different types of representations, it is important to select the most accurate one, the one that provides the best clarity of the data in context.
- Pictographs, line plots, bar graphs, multiple-bar graphs, and stacked-bar graphs are used to present qualitative data as well as discrete data.
- Histograms present continuous data using intervals. The bars in a histogram have no spaces between them because of the continuous nature of the data. This is in contrast to bar graphs, which have spaces between the bars to show that the categories are discrete.
- Broken-line graphs are used to show change over time and are useful for identifying trends. Students apply their understanding of scales and estimates to create broken-line graphs.
Source: Ontario Curriculum, Mathematics Curriculum Grades 1-8, 2020, Ontario Ministry of Education.
- Circle graphs are used to show how categories represent parts of a whole data set that can be either qualitative or quantitative data.
Source: Ontario Curriculum, Mathematics Curriculum Grades 1-8, 2020, Ontario Ministry of Education.
Example
Identification of the Type of Graphic Representation
In order to develop effective exercises in a local swimming class, data is collected to determine the average time underwater according to age in order to develop effective exercises in a local swimming class. Since the broken-line graph is used to show changes over time, it is appropriate to represent this data. In this situation, age, in years, will be represented on the horizontal axis, and time under water, in seconds, will be represented on the vertical axis. The graph should include sources, a title, labels and appropriate scales.
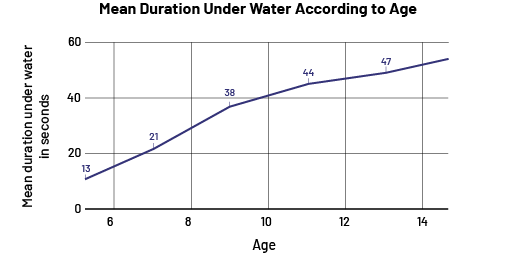 Image The broken line graph is titled "Mean duration underwater in relation to age". The horizontal axis, scaled from zero to 14, represents age, while the vertical axis, scaled from zero to 60, represents mean duration underwater in seconds. The broken line shows the following points: 13, 21, 38, 44 and 47.
The federal government conducted a labor force survey to find out the proportion of the working population paying taxes in each age group. A histogram is used when the data is continuous and organized into intervals. The histogram below shows the distribution for each age group well and includes sources, a title, labels and appropriate scales.
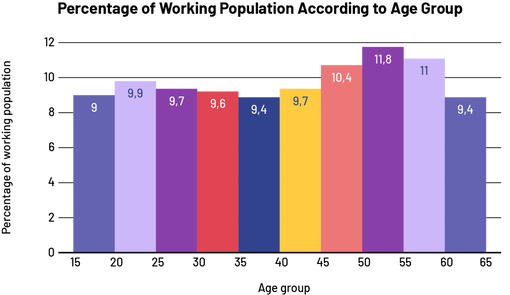 Image The coloured bar diagram illustrates the percentage of working population according to age group. The horizontal axis corresponds to the age group, from zero to 60. The vertical axis is the percentage of working population from zero to 12. The band from zero to 15 is located at 9. The band from 15 to 20 is located at 9.9. The band from 20 to 25 is located at 9.7. The band from 25 to 30 is located at 9.6. The band from 30 to 35 is located at 9.4. The band from 35 to 40 is located at 9.7. The band from 40 to 45 is located at 10.4. The band from 45 to 50 is located at 11.8. The band from 50 to 55 is located at 11. And the band from 55 to 60 is located at 9.4.
A computer manufacturing company wants to know which search browsers are the most popular. A circle graph is appropriate to show the part of the whole that each browser accounts for. The graph includes a source, a title, and labels for each browser.
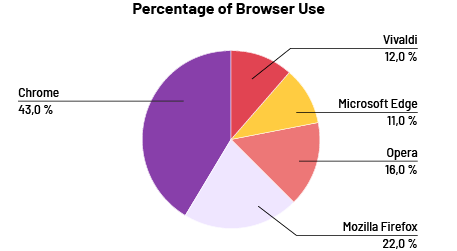 Image The pie chart illustrates the percentage of browser use. It is divided into five parts. Chrome represents 43 percent. Vivaldi represents 12 percent. Microsoft Edge represents 11 percent. Opera accounts for 16 percent. And Mozilla Firefox represents 22 percent.
Source: translated from En avant, les maths!, 8e année, CM, Données, p. 6-7.
Knowledge: Types of Graphs
Line Plot
The line plot is useful for representing a large amount of numerical data. Every data item is represented by an X and the Xs corresponding to the same quantity are arranged one above the other to form columns. Since the height of every column corresponds to the size of the frequency it represents, data analysis is easy.
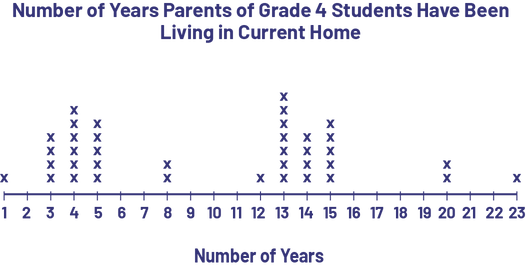 Image The number line is titled: "Number of years parents of grade 4 have been living in current home.” The line named "Number of Years" is scaled from one to 23. The number one shows the presence of one X. Number two has no X’s. Number 3 has 4 X’s. Number 4 has 6 X’s. Number 5 shows 5 X's. Numbers 6 and 7 show no X’s. Number 8 has two X's. Numbers 9, ten and 11 have no X’s. Number 12 has one X. Number 13 has 7 X's. Number 14 has 4 X's. Number 15 has 5 X's. Numbers 16, 17, 18 and 19 have no X. Number 20 has 2 X's. The numbers 21 and 22 have no X. Number 23 has one X.
It is easy to see from the distribution of Xs that there were two waves of moves, 3-5 years ago and 13-15 years ago, which could be the result of new housing construction or new jobs in the city.
Characteristics of a Line Plot
- it has a title;
- it has a graduated horizontal axis with a label.
- each data is represented by an X. The Xs that represent the same numerical data are aligned and are separated from each other by a constant space.
Source: translated from Guide d’enseignement efficace des mathématiques, de la 4e à la 6e année, Traitement des données et probabilité, p. 83.
Bar Graph (vertical or horizontal)
The bar graph is used to represent the frequencies of a data set. It is composed of bars whose length corresponds to the size of the frequencies. It allows the reader to see, at a glance, the distribution of the data in each category.
Note: To facilitate the construction of bar graphs, it is recommended that students use graph paper.
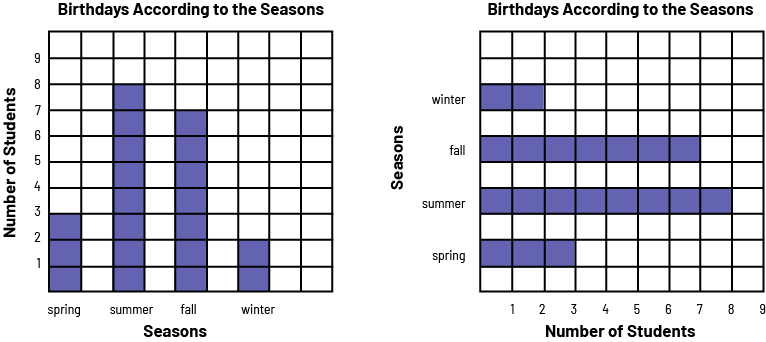
image A red 4 bar chart is titled "Birthdays According to the Seasons". The horizontal axis is named "Seasons," and the vertical axis is named "Number of Students". In spring, the bar goes up to 3. In summer, the bar goes up to 8. In the fall, the bar goes up to 7. And in the winter, the bar goes up to two.
image A diagram with 4 horizontal red bars is titled "Birthdays According to the Seasons". The horizontal axis is named "Number of Students", and the vertical axis is named "Seasons". In the spring, the bar indicates three students. In the summer, the bar indicates 8 students. In the fall, the bar indicates 7 students. And in the winter, the bar indicates two students.
Characteristics of a Bar Graph
- It has a title (for example, Birthdays according to the Seasons ).
- It has an axis (vertical or horizontal) graduated on an appropriate scale.
- It has another axis that represents categories (for example, spring, summer, fall, winter).
- The two axes each have a label (for example, Number of Students, Seasons).
- The bars have the same width and their length corresponds, according to the scale chosen, to the size of the population they represent (for example, if the scale is in intervals of 1, a bar of length 3 represents a population of 3).
- The bars are separated by equal spaces.
Source: translated from Guide d’enseignement efficace des mathématiques, de la 4e à la 6e année, Traitement des données et probabilité, p. 71-72.
Multiple-Bar Graph
The multiple-bar graph represents more than one set of data simultaneously to facilitate comparisons between them. It has the same characteristics as a bar graph, but each category has two or more bars of data. A key indicates what aspects are represented.
A multiple-bar graph can be constructed in either a horizontal or vertical orientation. The orientation chosen could depend on personal preference or on the purpose of the representation.
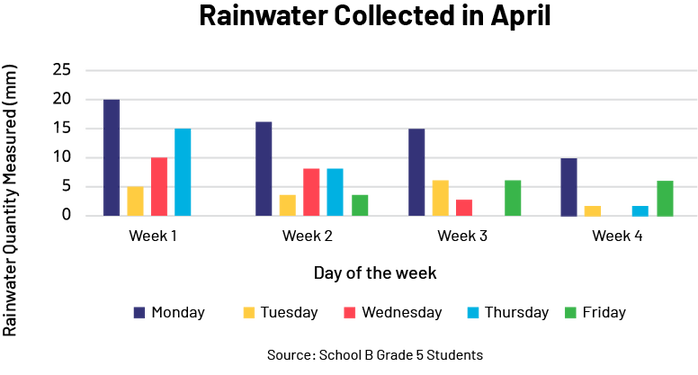
The title of the vertical multiple bar diagram is: Rainwater collected in April.
The title of the x-axis is: Week. The axis is graduated in four weeks, i.e. week 1, week 2, week 3 and week 4.
The title of the y-axis is: Rainwater quantity (mm). The axis is graduated by 5, from 0 to 25. There is a legend: blue is Monday, yellow is Tuesday, red is Wednesday, light blue is Thursday and green is Friday.
Below the legend it says "Source: School B Grade 5 Students".
Source: Ontario Curriculum, Mathematics Curriculum Grades 1-8, 2020, Ontario Ministry of Education.
The data can be organized in a way that makes it easier to compare categories of data with each other. For example, to compare the number and type of pets of students in Grades 1-6, data for Grades 1 to 3 and Grades 4 to 6 could be combined and represented in a double bar.
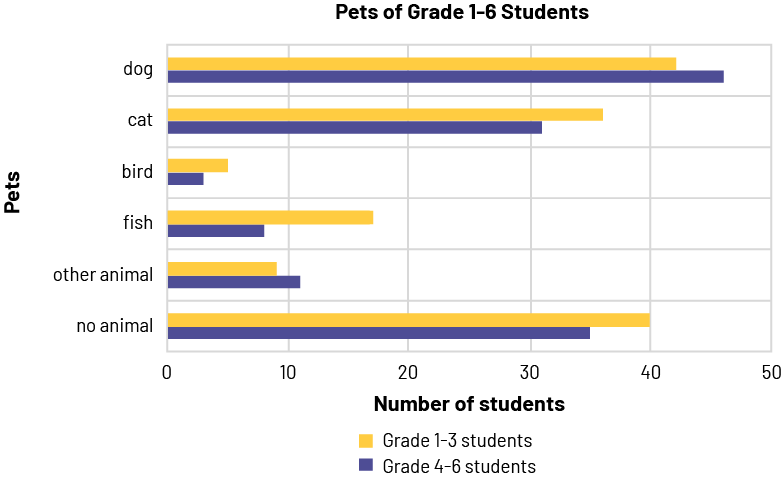
Image A double horizontal bar graph is titled "Pets of Grade 1 to 6 Students." The yellow bars correspond to students in grades one through three, while the purple bars correspond to students in grades four through six. The horizontal axis is named "Number of Students" and is graduated from zero to 50. The vertical axis is named "Pets".
For the dog, the horizontal yellow bar stops between 40 and 45 while the purple bar goes slightly over 45. For the cat, the yellow bar is slightly over 35 while the purple bar is slightly over 30. For the bird, the yellow bar reaches five while the purple bar stops before five. For fish, the yellow bar stops between 15 and 20 while the purple bar stops between five and ten. For "other animal", the yellow bar stops a little before ten and the purple bar goes slightly over ten. And for "no animal", the yellow bar reaches 40 while the purple bar reaches 35.
Stacked-Bar Graph
Stacked-bar graphs present data values proportionally. These graphs can be used to represent percentages or relative frequencies. Each bar in the graph represents the whole, and each of the segments in a bar represents a part (a different category). Different colours are used in each bar to differentiate between categories within the same bar. The stacked-bar graph can be created in more than one way to illustrate different comparisons.
Stacked bars are useful when there is a second variable in a data set, for example, a set that includes preferred kinds of granola bars and age.
Sources, titles, labels and scales provide important details about the data in a graph.
- The source indicates the origin of the data collected.
- The title presents the data of the graph.
- The labels indicate the categories used to classify the data.
- The scales indicate the values on axes of the graph.
- The values for relative frequencies are indicated using fractions, decimals or percentages.
Example
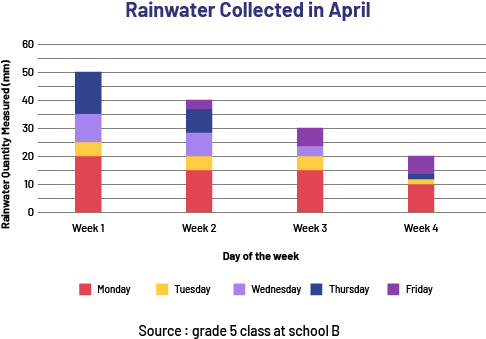 Image the title of the stacked bar diagram is: Rainwater collected in April. The title of the x-axis is: Day of the week. The axis is scaled into four weeks: week 1, week 2, week 3 and week 4. The title of the y-axis is: Rainwater Quantity Measured (in millimeters). The axis is graduated by 5, from 0 to 60. There is a legend: red is Monday, yellow is Tuesday, violet is Wednesday, navy blue is Thursday, and purple is Friday. Below the legend it says "Source: School B Grade 5 Students".
Source: Ontario Curriculum, Mathematics Curriculum Grades 1-8, 2020, Ontario Ministry of Education.
Broken-Line Graph
The broken-line graph is used to illustrate the trend in data overtime. Continuous data is a form of quantitative data that can be measured, but not counted, such as time, height and mass.
Example
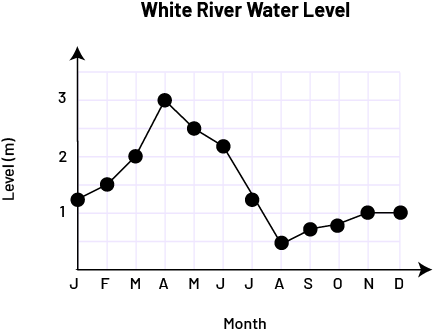 Image The broken line diagram with connected dots is titled "White River Water Level". The horizontal axis is named "Month" while the vertical axis, graduated from zero to three, is named "Level in metres". At the letter J, the point is slightly above one. At the letter F, the point is at one and a half. At the letter M, the point is at two. With the letter A, the dot is at three. With the letter M, the dot is two and a half. At the letter J, the point is above two. At the next letter J, the dot is between one and one and a half. At the letter A, the point is at one and a half. At the letter S, the dot is below one. At the letter O, the dot is slightly closer to number one. At the letter N and the letter D, the dot is at one.
Characteristics of a Broken-Line Graph
- It has a title (for example, White River Water Level).
- The axes each have an appropriate scale (for example, 0, 1, 2, 3 and J, F, M…).
- The axes each have a label (for example, Month, Level [m]).
- The data are represented by points.
- Consecutive points are connected by segments that indicate the change between the two corresponding data.
Source: translated from Guide d’enseignement efficace des mathématiques, de la 4e à la 6e année, Traitement des données et probabilité, p. 79-82.
Histogram
A histogram displays continuous quantitative data, such as height, age, or mass, using intervals. For each interval, a bar is drawn so that the width on the x-axis represents the range of its interval and whose height on the y-axis represents the value of the interval. There are no intervals between bars because of the continuous nature of the data. The graph formed by connecting the midpoints of the vertices of the columns of a histogram is called the frequency polygon.
Source: Ontario Curriculum, Mathematics Curriculum Grades 1-8, 2020, Ontario Ministry of Education.
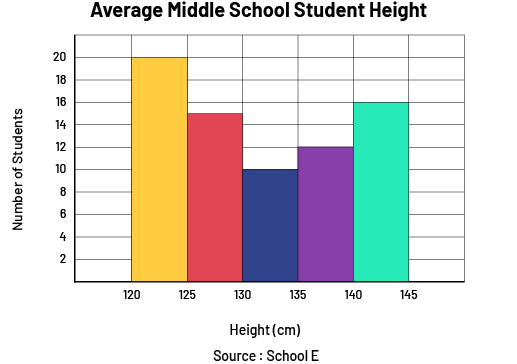 Image A graph with five coloured bars is titled "Average middle school student height". The horizontal axis is named "Height in centimeters" while the vertical axis, graduated from zero to 20, is named "Number of students”. The first bar rises to 20. The second bar rises to 15. The third bar rises to ten. The fourth bar rises to between dix and 15. And the fifth bar rises slightly above 15.
Source: Ontario Curriculum, Mathematics Curriculum Grades 1-8, 2020, Ontario Ministry of Education.
Knowledge: Circle Graph
The circle graph presents data in sectors proportional to the frequency of each category. It illustrates the whole data set divided into parts, with each sector representing a percentage of 360 degrees. Each sector, which is bounded by two radii, represents a category of data, and the area that the sector occupies in the circle is proportional to the set of data it represents.
The circle graph contains the following elements:
- a title;
- a circle divided into adjacent sectors;
- the designation of sectors using percentages;
- labels according to categories or using a key.
Source: adapted and translated from En avant, les maths! Données, 7e, CM, p. 3.
The more data represented, the larger the sector. The data are expressed as a percentage (%), and always add up to 100 percent. It is essential to have a title and a key or labels that designates the category of each sector.
Example
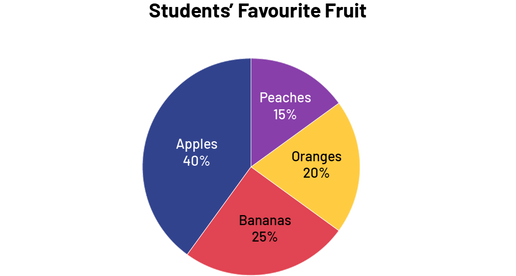 Image The pie chart titled "Students' Favorite Fruit" is divided into four coloured sections. The Apples section represents 40 percent of the circle. Peaches represent 15 percent. Oranges represent 20 percent. And Bananas represent 25 percent.
Data from different sectors should not be too similar, in terms of colour or size, because the circle graph can become too difficult to read and analyze. If the different sectors are approximately the same size, students should consider using a bar graph or a histogram.
Usually it is best to have no more than five or six sectors in a circle graph. If the data collected requires more than six sectors, the most important items are selected and the rest are grouped under the Miscellaneous or Other sector. This sector is always represented last, even if it does not represent the smallest data value.
Example
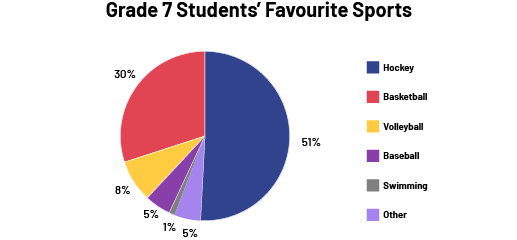 Image The pie chart titled " Grade 7 Students' Favourite Sports" is divided into six coloured sections. The Hockey section represents 51 percent of the circle. Basketball represents 30 percent. Volleyball represents eight percent. Baseball represents five percent. Swimming represents one percent. And Other represents 5 percent.
Circle graphs are used to represent the proportion of each category within a set.
Source: Ontario Curriculum, Mathematics Curriculum Grades 1-8, 2020, Ontario Ministry of Education.
In order to obtain the 360 degree percentage needed to construct the circle graph, the student must prepare the data by (1) determining the percentage of the whole, expressed as a decimal, that each category represents, and (2) multiplying this by 360 to determine the proportion of the circle needed to represent the category.
Example
If the athlete spends eight hours a week training and 60 minutes of that time is used for weightlifting, that means that 8% of his or her time is spent on weightlifting. So, to convert this information for use in a circle graph, the student needs to take the following two steps:
Step 1:
Transform the percentage into a decimal.
\(percentage \div 100\)
\(8 \div 100\)
\(= 0.08\)
Step 2:
Multiply the decimal number by 360 to determine the degree of the angle which will be proportional to the percentage.
\(decimal\ number \times 360^{\circ} \)
\(0.08 \times 360\)
\(= 28.8^{\circ} \)
Since the total percentage of the circle is 100% of the circle and there are 360 degrees in a circle, the ratio works. This means that a sector made with 28.8 degrees of the circle corresponds to the 8% of time devoted to weightlifting.
Source: Adapted from Statistics Canada website.
Elements to consider when constructing a circle graph:
- The data are discrete.
- Determine, using percent, the frequency associated with each category of data.
- Determine the measure of the angle at the center of each sector if a degree circle is used.
- Draw a circle, then use the percent circle or degree circle to draw the sectors.
- Label the graph with a descriptive title and a key explaining what each sector represents.
- If necessary, write the percentage and the category label next to each of the sectors to avoid having to constantly return to the key to interpret the graph.
Source: translated from Carte de route des apprentissages mathématiques, 7e année, Éducation Manitoba, p. 30.
Use of Technologies
Technologies can also be used to construct a circle graph. It allows for a quicker construction of a circle graph, since the calculations of the proportions of the sectors are done automatically. However, the student must be able to identify the different elements of the circle graph and interpret them accurately. The following are steps to follow when using an Excel spreadsheet to draw a circle graph. Student exploration of other spreadsheets, such as Google Sheets, is encouraged to create flexibility in the use of various technological tools.
Step 1:
Click on the Home tab and enter the categories in column A and the data in column B.
Select category names and data for each category.
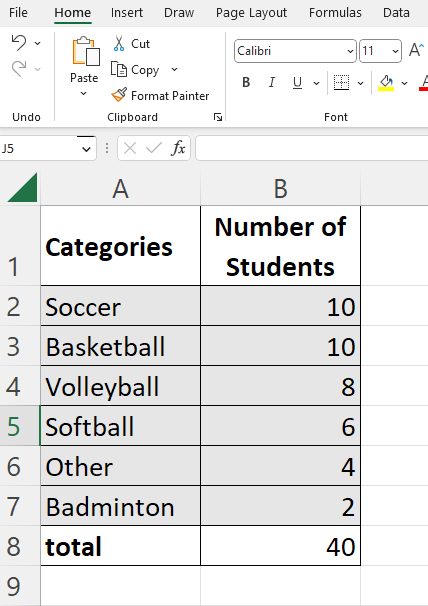 Image The top of the image shows the following Excel menus: File, Home, Insert, Page Layout, Formulas, Data. Below them, some tools: Cancel, Copy, Clipboard, Font. The Excel table shows 6 categories with the number of students for each. In the Soccer category, there are ten students. For Basketball, there are ten students. For Volleyball, there are 6 students. For Other, there are 4 students. For Badminton, there are 2 students. Total number of students: 40.
Step 2:
Click on the Insert tab, then on Insert Pie or Ring Chart, and select a pie chart type.
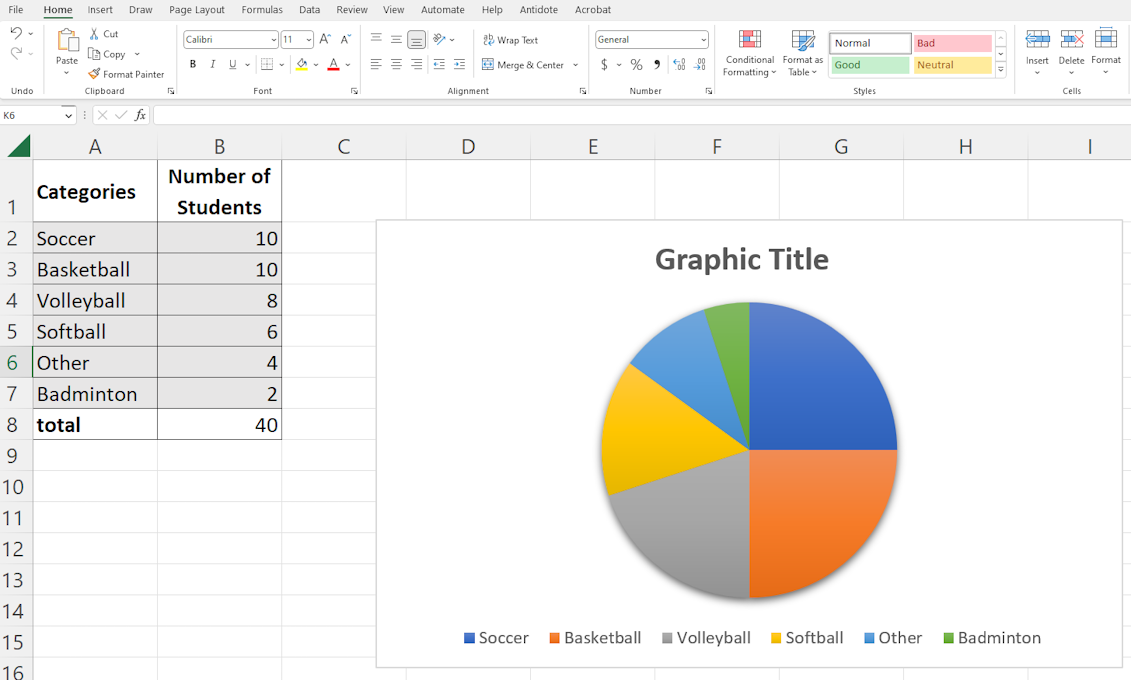 Image Next to the table is a pie chart that is being designed. The title has not yet been chosen; it says "Graphic Title". The circle is divided into 6 parts. The royal blue part, which is one quarter of the circle, represents soccer. The orange part, which is one quarter of the circle, represents basketball. Then, in descending order of size: volleyball in gray, softball in yellow, Other in light blue, and badminton in green.
Step 3:
Click on the Chart Elements icon to label the chart and insert the title.
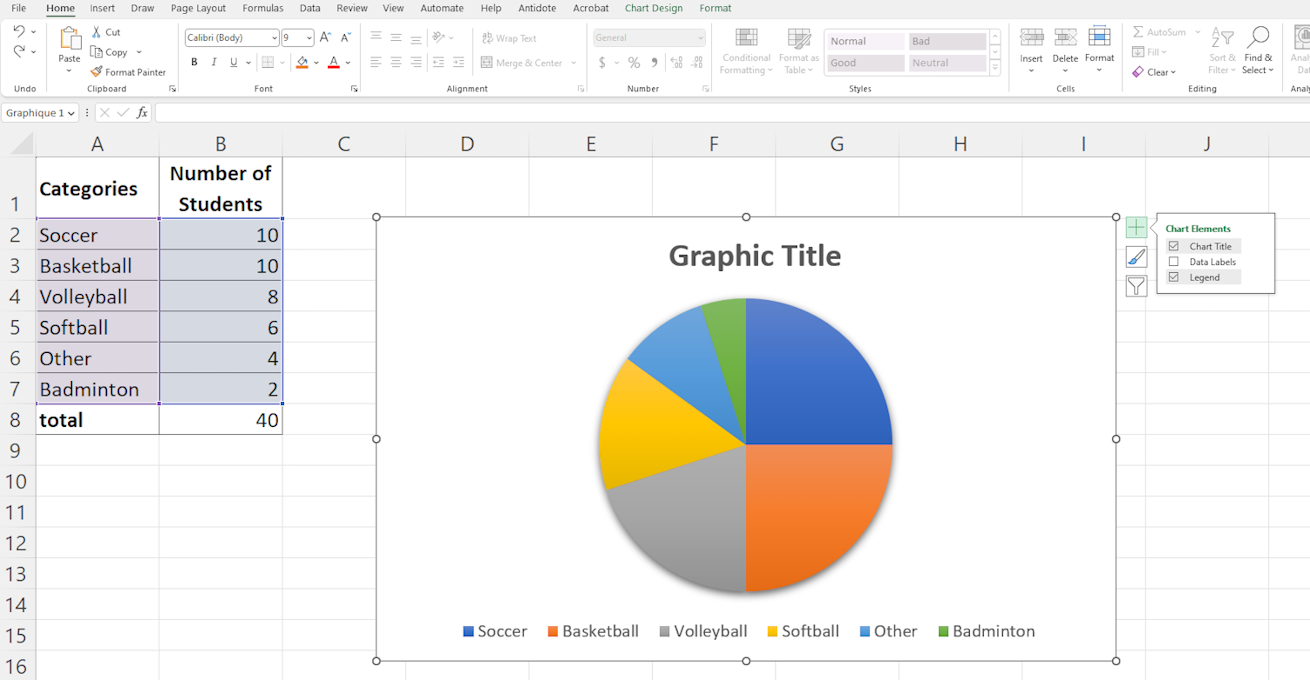 Image Next to the table is a pie chart that is being designed. The title has not yet been chosen; it says "Graphic Title". The circle is divided into 6 parts. The royal blue part, which is one quarter of the circle, represents soccer. The orange part, which is one quarter of the circle, represents basketball. Then, in descending order of size: volleyball in gray, softball in yellow, Other in light blue, and badminton in green.
Finally, click on the Chart Styles icon to choose the colours, label type, legend type, etc.
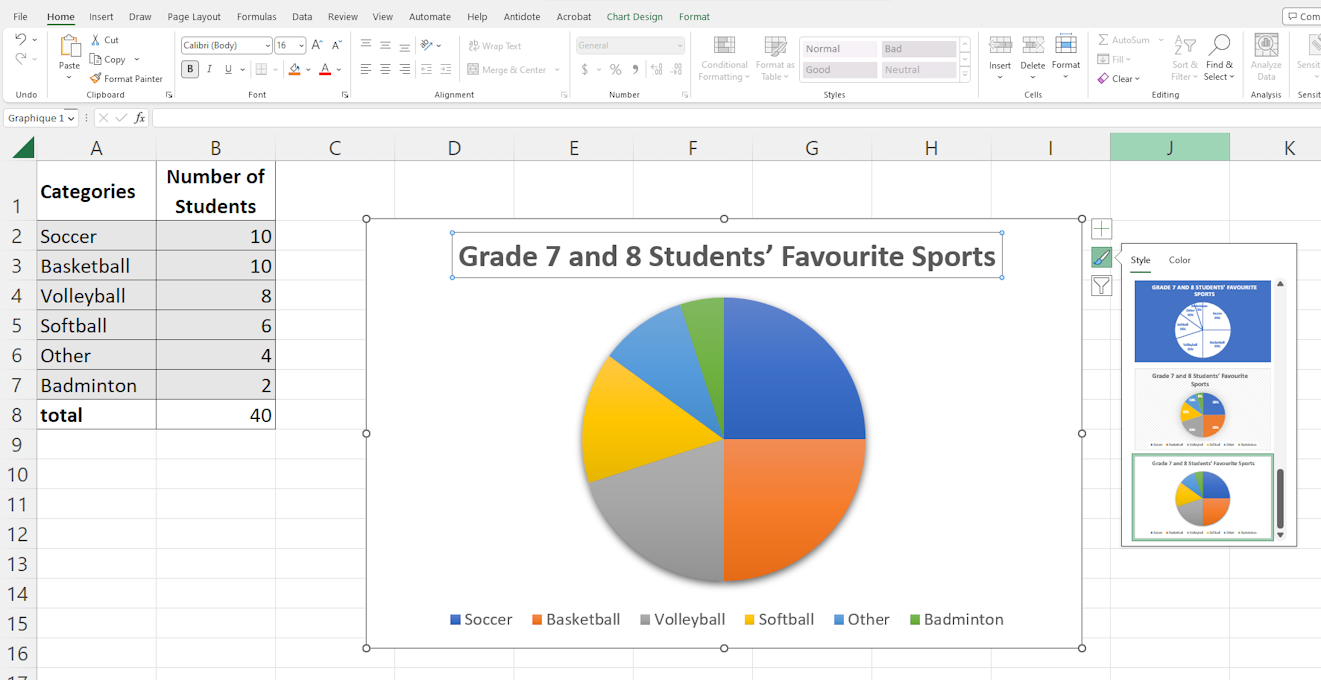 Image The pie chart is titled: Grade 7 and 8 Students’s Favourite Sports. The circle is divided into 6 parts. The royal blue part, which is one quarter of the circle, represents soccer. The orange part, which is one quarter of the circle, represents basketball. Then, in descending order of size: volleyball in gray, softball in yellow, Other in light blue, and badminton in green.
Source: translated from Carte de route des apprentissages mathématiques, 7e année, Éducation Manitoba, p. 31-32.
Knowledge: Sectors
The sector is the portion of the disk bounded by two radii.
Source: Le Robert online dictionary.
Example
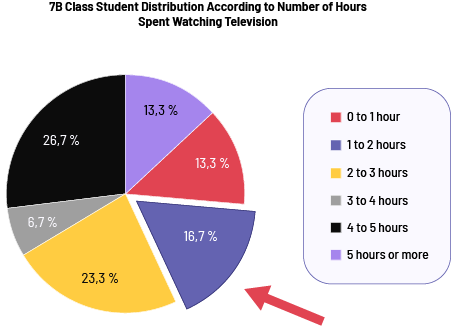 Image The coloured pie chart is titled "'7 B class student distribution according to number of hours spent watching television.” The "zero hour to one hour" portion takes up 13.3 percent of the circle. The "one hour to two hours" portion takes up 16.7 percent of the circle. It is slightly detached from the chart and has a red arrow pointing to it. The "two hours to three hours" portion takes up 23.3 percent of the circle. The "three hours to four hours" portion takes up 6.7 percent of the circle. The "four hours to five hours" portion takes up 26.7 percent of the circle. And the "five hours or more" portion takes 13.3 percent of the circle.
Source: adapted and translated from En avant, les maths!, 7e année, CM, Données, p. 3.
Knowledge: Key
The key is the explanatory note that describes each of the categories in the graph and helps the reader to understand the data.
Example
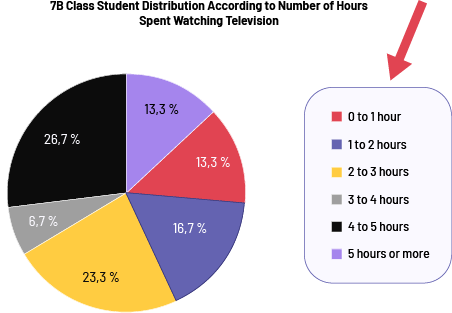 Image The coloured pie chart is titled "'Number of Hours Spent Watching Television” The "zero hour to one hour" portion takes up 13.3 percent of the circle. The "one hour to two hours" portion takes up 16.7 percent of the circle. The "two hours to three hours" portion takes up 23.3 percent of the circle. The "three hours to four hours" portion takes up 6.7 percent of the circle. The "four hours to five hours" portion takes up 26.7 percent of the circle. And the "five hours or more" portion takes 13.3 percent of the circle. A red arrow points to the legend of the sectors' colours according to the number of hours.
Source: translated from En avant, les maths!, 7e année, CM, Données, p. 3.
Knowledge: Title
The title presents the data of the graph.
Source: Ontario Curriculum, Mathematics Curriculum Grades 1-8, 2020, Ontario Ministry of Education.
Example
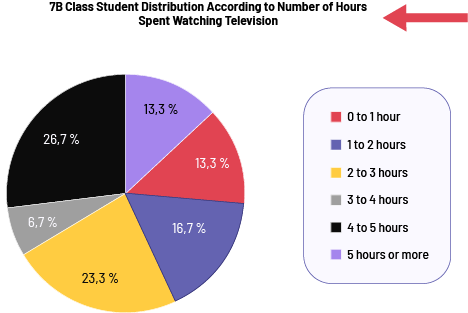 Image The coloured pie chart is titled "'Number of Hours Spent Watching Television” A red arrow points to the title. The "zero hour to one hour" portion takes up 13.3 percent of the circle. The "one hour to two hours" portion takes up 16.7 percent of the circle. The "two hours to three hours" portion takes up 23.3 percent of the circle. The "three hours to four hours" portion takes up 6.7 percent of the circle. The "four hours to five hours" portion takes up 26.7 percent of the circle. And the "five hours or more" portion takes 13.3 percent of the circle.
Source: translated from En avant, les maths!, 7e année, CM, Données, p. 3.
Knowledge: Label
The labels indicate the categories used to classify the data.
Source: Ontario Curriculum, Mathematics Curriculum Grades 1-8, 2020, Ontario Ministry of Education.
Example
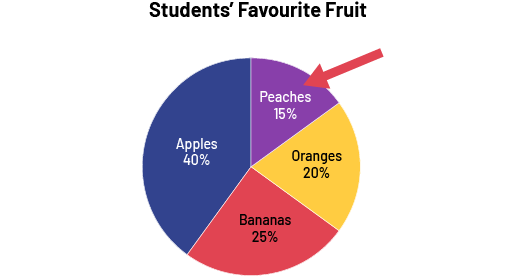 Image The pie chart titled "Students' Favorite Fruit" is divided into four coloured sections. The Apples section represents 40 percent of the circle. Peaches represent 15 percent. A red arrow points to the word “Peaches”. Oranges represent 20 percent. And Bananas represent 25 percent.
Knowledge: Source
The source indicates the origin of the data collected from the chart.
Example
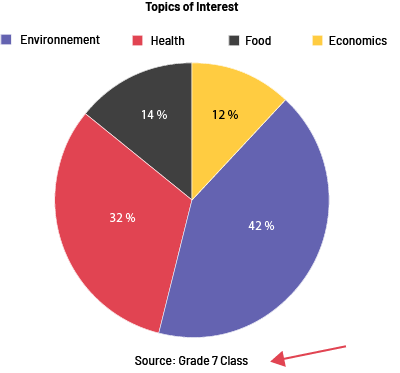 Image The pie chart titled "Topic of Interest" is divided into four parts. The environment represents 42 percent of the circle. Health is 32 percent of the circle. Food represents 14 percent, and economics represents 12 percent. At the bottom of the image, a red arrow points to the source: the grade seven class.
Source: Ontario Curriculum, Mathematics Curriculum Grades 1-8, 2020, Ontario Ministry of Education.