D1.4 create an infographic about a data set, representing the data in appropriate ways, including in tables and circle graphs, and incorporating any other relevant information that helps to tell a story about the data.
Activity 1: Analysis of Two Infographics
Here are two infographics created by Statistics Canada to present to students.
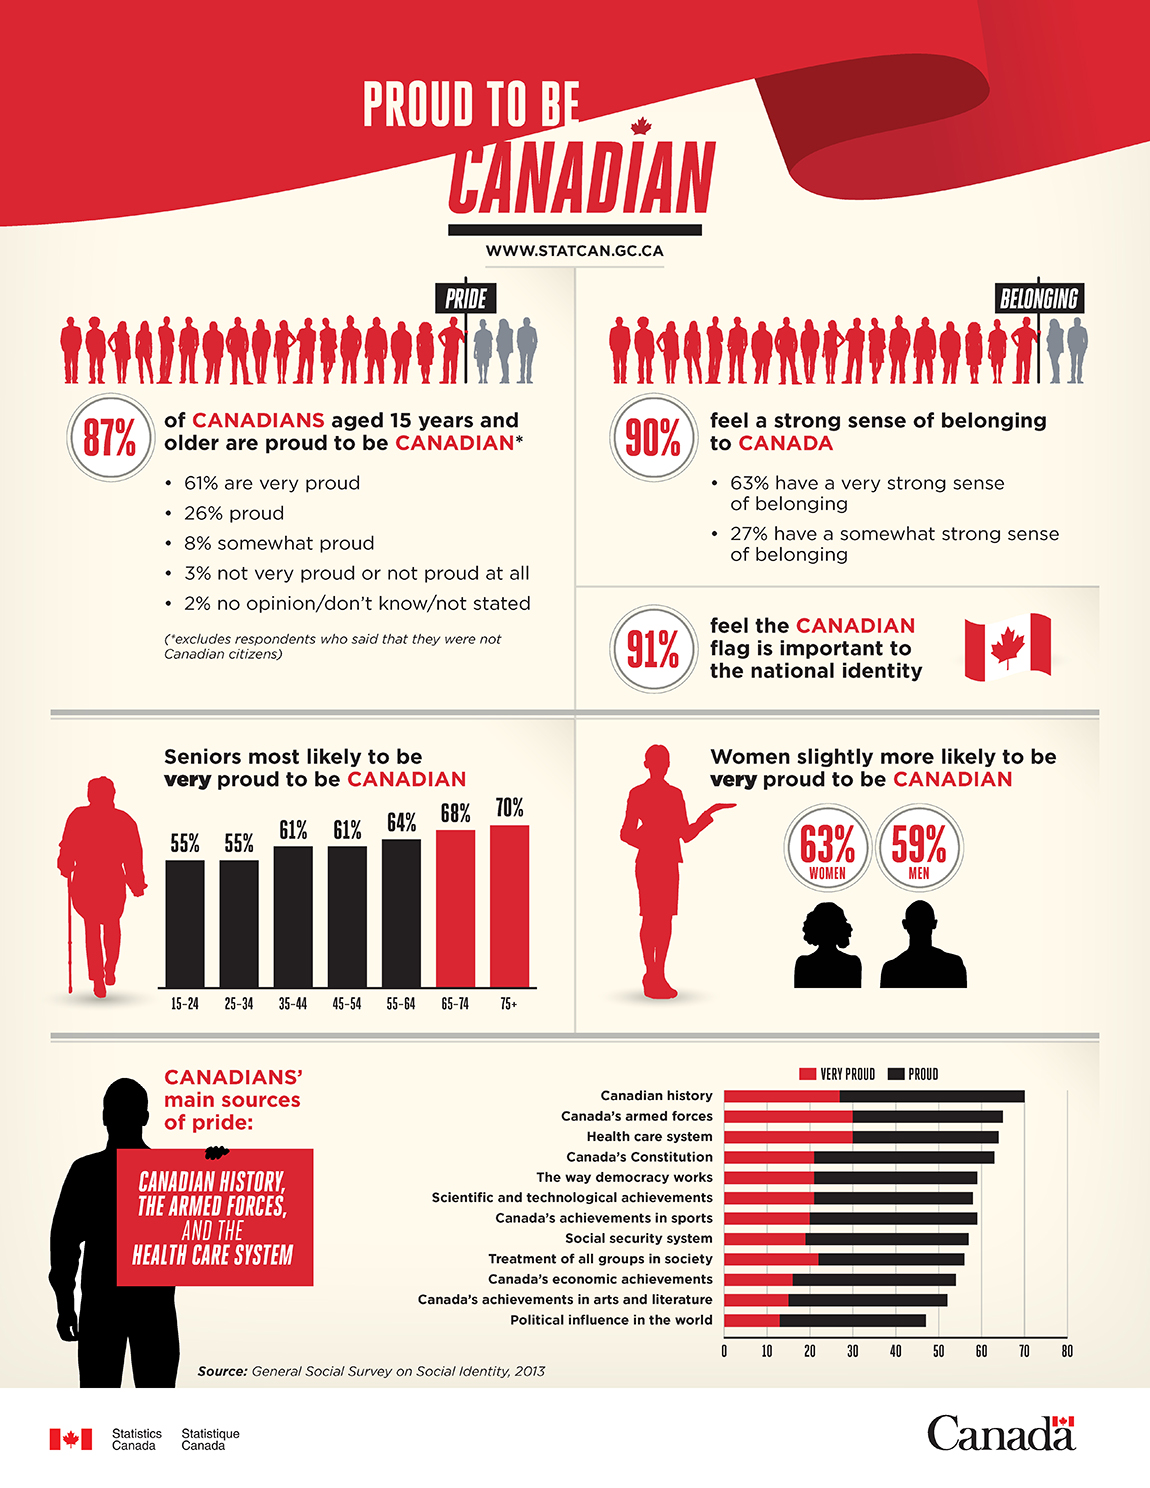 Image Infographic title: Proud to be Canadian. Source: General Social Survey on Social Identity, 2013. 87% of Canadians aged 15 and older are proud to be Canadian. This excludes respondents who reported not being Canadian citizens. 61% are very proud, 26% are proud, 8% are somewhat proud, 3% are not very proud or not at all proud, 2% indicated no opinion, don't know or did not report anything. 90% say they have a strong sense of belonging to Canada. 63% have a very strong sense of belonging. 27% have a somewhat strong sense of belonging. 91% feel that the Canadian flag is important to the Canadian identity. Seniors are more likely to be very proud to be Canadian. Among those aged 15 to 24, pride is at 55%. Between the ages of 25 and 34, pride is at 55%. Between the ages of 35 and 44, pride is 61%. 55 to 64 years old, pride is 64%. From 65 to 74, pride is 68%. And at age 75 and older, pride is at 70%. Women are slightly more likely to be very proud to be Canadian. 63% of proud people are women, and 59% are men.The main sources of pride for Canadians : Canada's history, the Canadian Armed Forces, the health care system. Sources of pride of Canadians. Regarding Canada's political influence in the world, 15% are very proud, and 34% are proud. Regarding Canada's achievements in the arts and literature, 15% are very proud, and 37% are proud. Regarding Canada's economic achievements, 16% are very proud, and 38% are proud. Regarding the way all groups in society are treated, 22% are very proud, and 34% are proud. Regarding the social security system, 19% are very proud, and 38% are proud. Regarding achievements in science and technology, 20% are very proud, and 39% are proud. Regarding achievements in sports, 21% are very proud, and 37% are proud. Regarding the way democracy works, 21% are very proud, and 38% are proud. Regarding the Canadian constitution, 21% are very proud, and 42% are proud. Regarding the health care system, 30% are very proud, and 34% are proud. Regarding the Canadian Armed Forces, 30% are very proud, and 35% are proud. And when it comes to Canada's history, 27% are very proud, and 43% are proud.
Source: Pride in being Canadian (statcan.gc.ca).
 Image Title of the infographic: Emergency preparedness et planning in Canada. Canadians that reside in a household with the following working devices: Smoke detectors: 98%. Carbon monoxide detector: 60%. Fire extinguisher: 66%. Approximately 42% of Canadians live in homes with all three of these devices. Safety precautions Canadians have taken to prepare in case of an emergency: Wind-up or battery-operated radio: 58%. Alternative source of heat: 48%. Alternative source of water: 43%. Backup generator: 23%. Emergency planning and preparedness activities. List of contact numbers: 69%. Emergency exit plan: 60%. Copies of important documents: 53%. Designated meeting place for household members: 33%. Emergency supply kit: 47%. Most common perceived weather-related, natural and human-induced hazards. Winter storms: 86%. Extended power outages: 76 Outbreaks of serious or life-threatening disease: 51%. Industrial or transportation accidents: 50%. Heat waves: 49%. Contamination or shortage of water or food: 44%. Floods: 42%. Earthquakes: 41%. Canadians that feel confident they would know what to do if confronted with an emergency situations: 74 %. Canadians that have someone to rely on in case of a major emergency. Help if injured: One to five people, 34%; More than five people, 60%. Emotional support: One to five people, 36%; More than five people, 59%. Place to stay: One to five people, 40%; More than five people, 54%. Financial help: One to five people, 59%; More than five people, 24%. Source: Survey of Emergency Preparedness and Resilience in Canada, 2014.
Source: Infographic: Emergency Preparedness and Emergency Planning Among Canadians (statcan.gc.ca).
Sample questions to ask students include:
- What conclusions can you draw from reading each infographic?
- What data representations did the Government of Canada use?
- Consider the source of the infographics. Who is the target audience? What messages are trying to be communicated?
- What changes would you make to make the infographics more engaging and relevant?
- What are the characteristics of these infographics that...?
Activity 2: Creation of an Infographic
Present students with the following situation:
The Ontario government is working to educate parents about their teens' use of electronic devices, with the ultimate goal of helping to protect youth from digital dangers. It is developing an infographic which includes survey data from Ontario youth about the types of applications they use on their electronic devices.
Using the frequency table below, have students create an infographic with a circle graph as part of it.
The Type of Applications That are Used by Teenagers
| Type of Applications | Frequency |
|---|---|
| News / information | 850 |
| Social Media | 2658 |
| Games | 1656 |
| Productivity | 1372 |
| Entertainment | 2269 |
| Usefulness | 1195 |
| Total | 10 000 |
Source: Revue TIC Ados
Source: translated from En avant, les maths!, 7e année, ML, Données, p. 17.