D1.1 Identify situations involving one-variable data and situations involving two-variable data, and explain when each type of data is needed.
Skill: Identifying Contexts With One-Variable or Two-Variable Data Sets
Setting the Context - One Variable
Determining What Can Be Measured or Counted
In order to identify what variable is represented in a graph, one must determine what can be measured or counted.
Example
 image The coloured pie chart is entitled "Canadian Mining Assets Abroad by Country". The "Other Countries" portion represents 26.5 percent. The USA portion represents 21.3 percent. Chile represents eleven point three percent. The Panama portion represents eight point two percent. The Brazil portion represents five point seven percent. The Peru portion represents five point three percent. The Zambia portion represents five percent. The Mexico portion represents four point eight percent. The Argentina portion represents four point five percent. The Mali portion represents four percent. And the Democratic Republic of Congo portion represents three point four percent.
Source: Canadian Mineral Assets (nrcan.gc.ca).
Looking at the graph, the variable represented is the percentage of Canadian mining assets abroad by country.
Reflection on the Type of Data
Since the number of Canadian mining assets abroad must be counted, I know that this is discrete quantitative data.
Setting the Context - Two Variables
Determining What Can Be Measured or Counted
In order to identify what variable is represented in a graph, one must determine what can be measured or counted.
Example
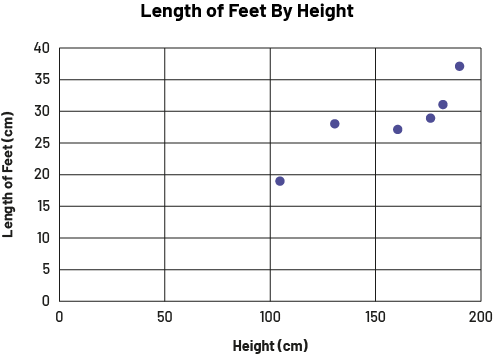 image The broken line graph is called "Length of Feet By Height". The horizontal axis is called "Height (cm)" and is graduated from zero to 200, while the vertical axis is called "Length of Feet (cm)" and is graduated from zero to 40. The first point is slightly after 100 on the horizontal axis and slightly before 20 on the vertical axis. The second point is between 100 and 150, and between 25 and 30. The third point is between 150 and 175, and between 25 and 30. The fourth point is between 150 and 200, and slightly before 30. The fifth point is between 150 and 200 and slightly past 30. And the sixth point is slightly before 200 and slightly after 35.
Looking at the graph, we notice that there are two variables represented, height in centimeteres and foot length in centimeteres.
Reflection on the Type of Data
Since height and foot length are data that must be measured, they are continuous quantitative data.
Source: adapted and translated from En avant, les maths!, 8e année, ML, Données, p. 3-4.
Find the Variables and the Type of Data
Example 1
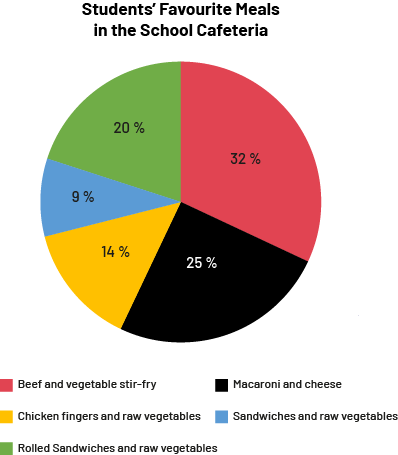 image The pie chart is titled "Student Favorite Meals in the School Cafeteria". The beef and vegetables stir-fry represents 32 percent of the chart. The macaroni and cheese represents 25 percent. The chicken fingers and cooked vegetables meal represents 14 percent. The sandwiches and raw vegetables meal represents 9 percent. And the sandwich wrap and raw vegetables meal represents twenty percent.
Explanation:
By looking at the graph, we can determine that it is a single-variable data set. In order to find the variable, we need to look for what is observed or measured about the individuals in a population. In this situation, it is the students' favourite food in the school cafeteria.
We are also looking to determine whether this is quantitative or qualitative data. In this situation, the names of the various dishes are non-numerical data so they are qualitative data.
Related to the data is the question, "What is your favourite thing to eat in the school cafeteria?" which could, among other things, allow the cafeteria manager to remove or add items to the menu to better meet their customers' preferences.
Example 2
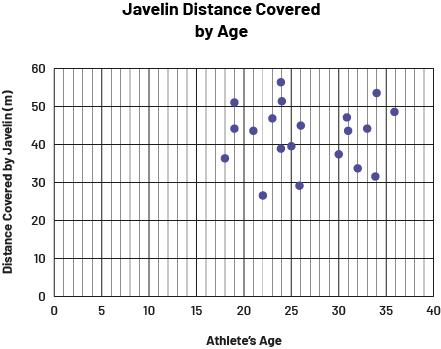 image The scatter diagram is titled "Javelin distance by age". The horizontal axis is scaled from zero to 40 and is called "Age of athletes", while the vertical axis is scaled from zero to 60 and is called "Distance covered by the javelin in meters". On the horizontal axis, the closest dot to zero is at 19 and the farthest dot is at 36. On the vertical axis, the closest dot to zero is at 25 to 30 (age 23) and the farthest dot is at 50 to 60 (age 24).
Explanation:
By looking at the scatter plot, we can determine that this is a two-variable data set. In order to find the variables, we look for what is observed or measured on the individuals in a population. In this situation, it is the distance covered by the javelin according to the age of the athletes. So these two items are the variables in this situation.
We are also trying to determine whether they are quantitative or qualitative data. In this situation, both data are numerical and are measuring, so they are continuous quantitative data.
The question "Does age affect the distance an athlete can throw the javelin?" could be asked of this data. A coach could use the graph to show their athletes that there is no relationship between the age of the athletes and the distance they throw and that therefore, technique is important.
Skill: Explaining Contexts in Which Each Type of Data is Needed
The single-variable data set is used only when one element in a population is observed, while the two-variable data set is used when two elements in the same population are observed and compared.
Example 1
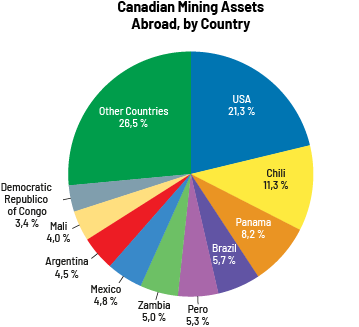 image The scatter diagram is titled "Javelin distance by age". The horizontal axis is scaled from zero to 40 and is called "Age of athletes", while the vertical axis is scaled from zero to 60 and is called "Distance covered by the javelin in meters". On the horizontal axis, the closest dot to zero is at 19 and the farthest dot is at 36. On the vertical axis, the closest dot to zero is at 25 to 30 (age 23) and the farthest dot is at 50 to 60 (age 24).
Source: Canadian Mineral Assets (nrcan.gc.ca).
Among other things, this type of data can be used to:
- determine the extent of Canadian companies' global presence in the top 10 countries;
- to help Canadian companies know where to invest in the coming years;
- show the geographic distribution of Canadian assets around the world (for example, Africa, Europe, South America, Asia).
Example 2
 image The broken line graph is called "Length of Feet By Size". The horizontal axis is called "Size in centimeters" and is graduated from zero to 200, while the vertical axis is called "Length of Feet in centimeters" and is graduated from zero to 40. The first point is slightly after 100 on the horizontal axis and slightly before 20 on the vertical axis. The second point is between 100 and 150, and between 25 and 30. The third point is between 150 and 175, and between 25 and 30. The fourth point is between 150 and 200, and slightly before 30. The fifth point is between 150 and 200 and slightly past 30. And the sixth point is slightly before 200 and slightly after 35.
This type of data could be used by sports equipment companies to:
- determine if there is a relationship between a person's height and length of a person's feet. If so, the ordering of shoes could be based on the ordering of clothing;
- help health professionals predict an individual's height based on the length of their feet or vice versa.
Source: adapted and translated from En avant, les maths!, 8e année, CM, Données, p. 4.
Knowledge: Variable
A variable is any attribute, number, or quantity that can be measured or counted.
Source: The Ontario Curriculum. Mathematics, Grade 1-8 Ministry of Education, 2020
Knowledge: Single-Variable Data Set
One-variable data refers to one data set from a sample or a population that can be either qualitative or quantitative. Situations involve representing and analyzing the data based on that one variable to answer a question like “What is the average height of all the students in the class?”
Source: The Ontario Curriculum. Mathematics, Grade 1-8 Ministry of Education, 2020
Knowledge: Two-Variable Data Set
Two-variable data refers to two data sets from the same sample or population that can be either qualitative or quantitative. Situations involve representing and analyzing the data based on two variables to answer questions like “Is there a relationship between a person’s height and the length of their arm span?”
Source: The Ontario Curriculum. Mathematics, Grade 1-8 Ministry of Education, 2020
Knowledge: Qualitative Data
Non-numerical data that can be organized by categories, such as type of pet, or eye colour.
Source: The Ontario Curriculum. Mathematics, Grade 1-8 Ministry of Education, 2020
Knowledge: Quantitative Data
Data that is numerical and acquired through counting (discrete data) or measuring (continuous data); for example, number of sides or amount of rainfall.
Discrete Data
A form of quantitative data. Discrete data is data that can be counted, such as the number of pets, the number of siblings, or the number of buttons.
Continuous Data
A form of quantitative data. Continuous data is data that can be measured but not counted, such as time, height, and mass.
Source: The Ontario Curriculum. Mathematics, Grade 1-8 Ministry of Education, 2020
Knowledge: Population
The total set of subjects (for example, individuals, objects, species) that fit a particular description; for example, salmon in Lake Ontario.
Source: The Ontario Curriculum. Mathematics, Grade 1-8 Ministry of Education, 2020
Knowledge: Sample
Gathered information from a subset of a population.
Source: The Ontario Curriculum. Mathematics, Grade 1-8 Ministry of Education, 2020