D2.1 Solve various probability problems, using appropriate tools and strategies, including Venn diagrams and tree diagrams.
Knowledge: Probability Problem
To solve a probability problem, students must draw on their prior knowledge related to probability, make predictions, try different strategies, make connections, and draw conclusions.
Source: The Ontario Curriculum. Mathematics, Grade 1-8 Ministry of Education, 2020
Example
In a group of 10 children who want to spend time together, three children only want to play soccer, three only want to play basketball, two children want to play either sport, and two children do not want to play. What is the probability that one child only wants to play basketball?
Knowledge: Venn Diagram
The Venn diagram is a schematic representation of sets that highlights their union and intersection, allowing to classify data according to common characteristics and to highlight relationships between these data.
Example
At a school celebration, each student in the class was offered the opportunity to order a slice of pizza, juice and dessert.
Here is a part of the order data.
- Niimi ordered a slice of pizza, juice and dessert.
- Tao ordered a slice of pizza and a juice.
- Marek ordered a juice.
- Jamila ordered nothing.
This data can be represented using a Venn diagram. The diagram will include three circles, one for each of the three choices available to the students. Here is one way to represent Niimi's, Tao's, Marek's and Jamila's choices.
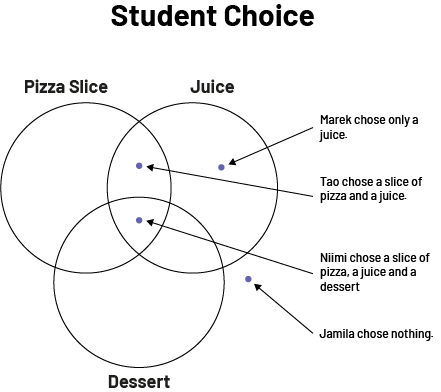 image The Venn diagram is entitled "Student Choice". The three sets are named respectively as follows: pizza slice, juice, dessert. There are four dots. The first is outside the diagram and comes with the text "Jamila chose nothing". One dot is in the common center of the three sets and comes with the text, "Niimi chose a slice of pizza, a juice and a dessert." A dot is found in the shared set between pizza slice and juice, and comes with the following text: "Tao chose a slice of pizza and a juice". And one dot is in the set exclusive to juice, and comes with the following text: "Marek chose only a juice".
If we represent all the choices of the students in the class, we get the following.
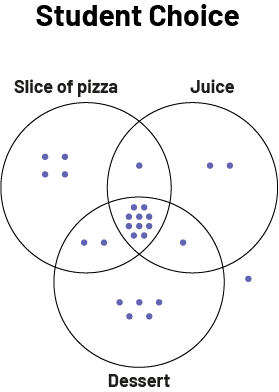 image The Venn diagram is titled "Student Choice". The three sets are named respectively as follows: pizza slice, juice, dessert. In the pizza slice exclusive set, there are four dots. In the juice exclusive set, there are two dots. In the dessert exclusive set, there are five dots. Outside the diagram, there is one dot. In the shared set with all three choices, there are ten dots. In the shared pizza slice and juice set, there is one dot. In the shared pizza slice and dessert set, there are two dots. And in the shared set of juice and dessert, there are five dots.
We can then write in each circle the number of points it contains.
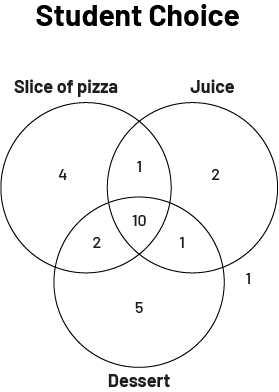 image The Venn diagram is titled "Student Choice". The three sets are named respectively as follows: pizza slice, juice, dessert. In the pizza slice exclusive set, there is a number four. In the juice exclusive set, there is a number two. In the dessert exclusive set, there is a number five. Outside the diagram, there is un number one. In the shared set with all three choices, there is a number ten. In the shared pizza slice and juice set, there is a number one. In the shared pizza slice and dessert set, there is the number two. And in the shared set of juice and dessert, there is the number five.
From the last graph, we can see, for example, that 10 students ordered a slice of pizza, juice, and dessert, four students ordered a slice of pizza only, and two students ordered a slice of pizza and dessert.
Source: adapted and translated from Guide d’enseignement efficace des mathématiques, de la 4e à la 6e année, Traitement des données et probabilité, p. 84-86.
Knowledge: Tree Diagram
The tree diagram is used to count possible outcomes in order to highlight the set of possible choices.
Example
Here is part of a tree diagram that shows the possible outcomes when three dice are rolled. In this part of the diagram, the first die rolled is a 1 and the results of the three dice faces are combined to form a number.
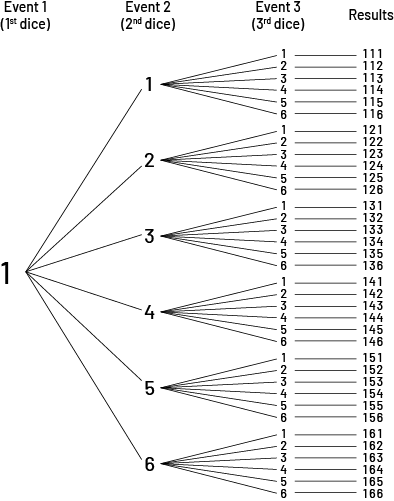 image The tree diagram elaborates all the scenarios of three events. At event one, with first die, there is the number one. At event two, with second die, there are the numbers one through six, all related to event one. And at event three, with third die, there are the numbers one through six, all related to each of the numbers one through six in event two. This gives six sets of six outcomes. In the first set of outcomes, the numbers go from 111 to 116. In the second set, the numbers range from 121 to 126. In the third set, the results range from 131 to 136. In the fourth set, the results range from 141 to 146. In the fifth set, the results go from 151 to 158. And in the sixth set, the results range from 161 to 166.
Source: translated from En avant, les maths, 8e année, SA, p. 16.