D2.2 Determine and compare the theoretical and experimental probabilities of multiple independent events happening and of multiple dependent events happening.
Skill: Comparing Theoretical and Experimental Probability
In the intermediate grades, students learn to distinguish between independent and dependent events and to compare the theoretical and experimental probability of more than one of these events occurring. Students also use various diagrams to determine the theoretical probability of more than one event.
Probability experiments are essential to the development of a sound understanding of the concept of theoretical probability so once students have established the theoretical probability of some outcome, teachers can suggest that they test that probability experimentally. This kind of activity also helps students to better understand that uncertainty is inherent in any situation involving chance. For example, even if students establish that the theoretical probability of some outcome is equal to \(\frac{1}{4}\), there is no guarantee that they will get that outcome one-fourth of the time during an experiment.
Source: translated from Guide d’enseignement efficace des mathématiques, de la 4e à la 6e année, Traitement des données et probabilité, p. 142.
Experimental probability demonstrates that if a probability experiment is performed enough times and the frequency of each outcome is recorded, this frequency can be used to determine an approximation of the theoretical probability.
Source: translated from Guide d’enseignement efficace des mathématiques, de la 4e à la 6e année, Traitement des données et probabilité, p. 151.
In order to develop an understanding of the concept of theoretical probability, students need to use both their intuitive and analytical thinking, so it is important that teachers present them with situations that involve both theory and practice in order to encourage a back-and-forth between these two modes of thinking.
Source: translated from Guide d’enseignement efficace des mathématiques, de la 4e à la 6e année, Traitement des données et probabilité, p. 138.
Knowledge: Theoretical Probability
The theoretical probability helps to quantify the randomness and uncertainty of an event or outcome. This quantity can be represented by a fraction between 0 and 1.
Example
n a coin toss, the theoretical probability of getting tails is equal to \(\frac{1}{2}\). This fraction indicates that the game has two equally likely outcomes and that one of these outcomes is tails. In other words, in this game, there is a 1 in 2 chance of getting tails.
Teachers should be aware that if all possible outcomes of an experiment are equally likely, the theoretical probability of any outcome A is formally defined as follows.

Thus, if we want to determine the probability of obtaining an even number by throwing a six-sided die, we need only recognize that there are 6 possible outcomes (1, 2, 3, 4, 5 and 6) and that 3 of these outcomes correspond to an even number (2, 4 and 6). We can therefore say that the theoretical probability of obtaining an even number is equal to \(\frac{3}{6}\), in other words that there are 3 possibilities out of 6 that the outcome corresponds to an even number. The notation P(A) is commonly used to describe the probability of any outcome A. Thus, in the previous situation, we could write P(even number) = \(\frac{3}{6}\).
In some situations, a desired outcome may never occur; for example, getting a number greater than 6 by rolling the die, so the probability of this outcome is equal to 0. In other situations, it is certain that the desired outcome will occur; for example, getting a number less than 7 by rolling the die, so the probability of this outcome is equal to 1.
Theoretical probability helps us to make informed decisions in any random situation. Since in such situations it is impossible to predict the outcome without the risk of being wrong, we can reduce this risk by determining the theoretical probability of each outcome and choosing the outcome with the highest probability. This is a way of "mathematizing chance".
Theoretical probability is an abstract mathematical concept that is not always easy to grasp. However, understanding it is essential to the development of probabilistic thinking. To ensure that this understanding is not simply a matter of learning a formula, it must be the result of a lengthy process in which teachers expose students to a variety of probability situations, games, or experiments that help them to confront theory and practice. This approach often counters misconceptions for students who may be led by intuition or faulty analysis in the face of a particular situation. Even among adults, it is very common to misunderstand a seemingly straightforward probability situation.
Development of the Concept of Theoretical Probability
In the junior grades, students gradually develop an understanding of the concept of theoretical probability. In Grade 4, for example, they can state that there is a 1 in 6 chance of getting the number 4 by rolling a die. In Grade 5, they learn to express this probability using a fraction, \(\frac{1}{6}\). In Grade 6, they can also use a decimal or percentage to represent the probability of an outcome. In Grade 7, students learn to distinguish between independent and dependent events by explaining why their respective probabilities differ and in Grade 8 they determine the probability of multiple independent and dependent events.
Source: translated from Guide d’enseignement efficace des mathématiques, de la 4e à la 6e année, Traitement des données et probabilité, p. 137-139.
Note: If we know the theoretical probability of any outcome of an experiment, the Law of Large Numbers states that the more often we do the experiment, the closer the ratio of the frequency of the outcome to the number of trials will get to the theoretical probability.
Proportional Reasoning
There is an important link between probabilistic thinking and proportional reasoning. Proportional reasoning helps students recognize the equivalence relationship between two probability situations, thus contributing to an understanding of the concept of theoretical probability. Teachers should provide students with a variety of activities that encourage them to make this connection.Example 1: Two Independent Events
Present the following situation to the students.
Veronica would like to do an activity with one of her friends. She is deciding between asking Astryde, Hakima, Sophie or Ines, and she is also deciding between going to the park, riding a bike or going to the pool. If she decides to choose the friend and the activity at random, what is the probability that Veronica :
- goes to the pool with Hakima?
- does an activity with Ines?
- rides a bike?
Students can draw two spinners to better visualize the situation.
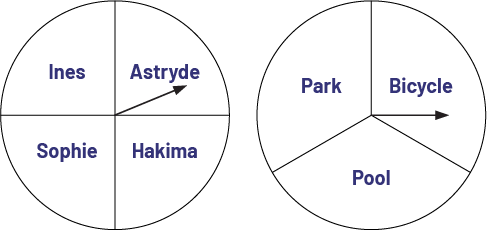 image Two wheels with a needle are placed side by side. The first wheel is divided into four equal parts, each containing a name: Inès, Astryde, Sophie, Hakima. The arrow points to the Astryde part. The second wheel is divided into three equal parts and contains respectively the following words: park, bicycle, pool. The arrow points to the bicycle part.
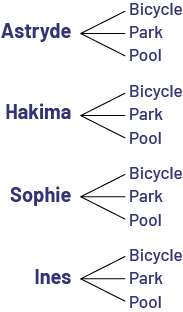
When we rotate the two arrows, we are interested in the probability of the combined outcomes. First, we need to identify and list the equally likely outcomes. If the first arrow stops on the name Astryde, the second arrow can stop on the activity Park, Bike or Pool. The same thing happens if the first arrow stops on the name Hakima, Sophie or Ines. So there are 12 equally likely results that can be represented:
- a tree diagram;
- with the help of a table;
| Bike | Park | Pool | |
|---|---|---|---|
| Astryde | Bicycle with Astryde | Park with Astryde | Swimming pool with Astryde |
| Hakima | Bicycle with Hakima | Park with Hakima | Swimming pool with Hakima |
| Sophie | Bicycle with Sophie | Park with Sophie | Swimming pool with Sophie |
| Ines | Bicycle with Ines | Park with Ines | Swimming pool with Ines |
- using an ordered list.
- Astryde and bike, or park, or pool
- Hakima and bike, or park, or pool
- Sophie and bike, or park, or pool
- Ines and bike, or park, or pool.
or
- Bike with Astryde, or Hakima, or Sophie or Ines
- Park with Astryde, or Hakima, or Sophie or Ines
- Swimming pool with Astryde, or Hakima, or Sophie or Ines
Regardless of the representation used, students can then see that there is only 1 outcome among the 12 equally likely outcomes that corresponds to going to the pool with Hakima. The probability that Veronica will go to the pool with Hakima is therefore equal to \(\frac{1}{12}\). To answer the other two questions, students can refer to the 12 possible outcomes or only to the roulette wheel corresponding to the question. Thus, the probability that Veronica does an activity with Ines is equal to \(\frac{3}{12}\) or \(\frac{1}{4}\). The probability that she goes cycling is equal to \(\frac{4}{12}\) or \(\frac{1}{3}\).
After determining these probabilities, students can perform a probability experiment to test the reasonableness of their answers using two spinners like the ones shown above. They can also put four different coloured tokens in a first bag and three different coloured tokens in a second bag. Each token in the first bag is associated with one of the four friends, and each token in the second bag is associated with one of the three activities. The experiment then consists of drawing a token from each bag and recording the results. Teachers should remind students of the importance of performing the experiment a sufficient number of times.
Example 2: Two Dependent Events
Present the students with a bag containing a red marble, a green marble and a blue marble. The situation involves drawing a marble from the bag twice and noting its colour. Between the two draws, the marble must not be returned to the bag. Ask students to determine the probability of getting:
- two red marbles;
- a red marble and a blue marble;
- two marbles of different colours.
To solve this problem, students must list all six possible, equally likely outcomes. To do this, they can use:
- a tree diagram;
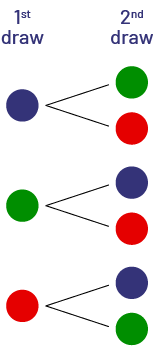 image The tree diagram has two columns: first choice and second choice. Under first choice, three coloured chips are placed one below the other: one blue, one green and one red. Two branches leading to the second choice unfold from each. For the blue chip, the second choice is green or red. For the green chip, the second choice is blue or red. And for the red chip, the second choice is blue or green.
- a table;
| Blue | Green | Red | |
|---|---|---|---|
| Blue | BB | BG | BR |
| Green | GB | GG | GR |
| Red | RB | RG | RR |
- an ordered list.
- blue, green
- blue, red
- green, blue
- green, red
- red, blue
- red, green
Based on these results, students can determine that the probability of getting:
- two red marbles is equal to 0;
- a red marble and a blue marble is equal to \(\frac{2}{6}\);
- two marbles of different colour is equal to 1.
Students should then have the opportunity to test the reasonableness of their answers by conducting a probability experiment.
Source: adapted and translated from Guide d’enseignement efficace des mathématiques, de la 4e à la 6e année, Traitement des données et probabilité, p. 143-149.
Knowledge: Experimental Probability
Experimental probability is used in situations where it is impossible to determine the theoretical probability of a particular event or outcome.
Example
Weather forecasts, life expectancy estimates, or the probability of hitting a free throw in basketball.
Experimental probability should be taught using real-life situations; for example, teachers can present a variety of situations involving the activity of drawing several objects from a bag whose exact contents are unknown. They can also present situations in which the possible outcomes are not equally likely. In addition, they can present situations in which the outcomes depend on each other.
Source: translated from Guide d’enseignement efficace des mathématiques, de la 4e à la 6e année, Traitement des données et probabilité, p. 150.
Example 1: Two Independent Events
Compare the experimental probabilities with the theoretical probabilities previously determined in the following situation:
Veronica would like to do an activity with one of her friends. She hesitates between asking Astryde, Hakima, Sophie or Ines, and she hesitates between going to the park, riding a bike or going to the pool. If she decides to choose the friend and the activity at random, what is the probability that Veronica:
- goes to the pool with Hakima?
- does an activity with Ines?
- rides a bike?
Have students perform the experiment using spinners or using block coding software.
image Two wheels with a needle are placed side by side. The first wheel is divided into four equal parts, each containing a name: Fanny, Astryde, Sophie, Hakima. The arrow points to the Amélie part. The second wheel is divided into three equal parts and contains respectively the following words: park, bicycle, pool. The arrow points to the bicycle part.
In teams of two, students spin the first wheel, then the second, and record their results in a table. After running the experiment 20 times, they compare their results with the theoretical probabilities they have determined. They can note how their results differ from the theoretical results of going to the pool with Hakima, doing an activity with Ines, and riding a bike.
Students discover that the results of a probability experiment can be very different from what the theoretical probability would suggest, because all outcomes are possible, even those that seem unlikely.
Example 2: Two Dependent Events
Compare the experimental probabilities with the theoretical probabilities previously determined in the following situation:
The teacher presents the students with a bag containing a red marble, a green marble and a blue marble. The situation involves drawing a marble from the bag twice and noting its colour. Between the two draws, the marble must not be put back in the bag. The teacher asks them to determine the probability of obtaining:
- two red marbles;
- a red marble and a blue marble;
- two marbles of different colours.
Have students perform the experiment using a brown bag and red, green and blue marbles or using block coding software.
In pairs, students draw one marble from the bag and then, without putting the marble back in, draw a second marble from the bag. They record their results in a table. After performing 20 draws, they compare their results with the theoretical probabilities previously determined. They may note how their results differ from the theoretical results of drawing two red marbles, one red and one blue marble, and two marbles of different colours.
Students discover that the results of a probability experiment can be very different from what the theoretical probability would suggest, because all outcomes are possible, even those that seem unlikely.
Source: adapted and translated from Guide d’enseignement efficace des mathématiques, de la 4e à la 6e année, Traitement des données et probabilité, p. 145-149.
Independent and Dependent Events
Note that in Example 1, the outcome of the second draw does not depend on the outcome of the first. In mathematics, these are called independent events. This is another opportunity for students to understand the idea that chance has no memory. In Example 2, the outcome of the second draw depends on the outcome of the first. In mathematics, these are called dependent events. If the marble is put back in the bag after the first draw, there are three possible outcomes on the second draw. The total number of possible equally-likely outcomes would be 9. However, since the marble is not put back in the bag after the first draw, there are only two possible outcomes on the second draw. The total number of possible equally-likely outcomes would be 6.
Source: translated from Guide d’enseignement efficace des mathématiques, de la 4e à la 6e année, Traitement des données et probabilité, p. 149.