D2.1 Solve various probability problems, using appropriate tools and strategies, including Venn diagrams and tree diagrams.
Activity 1: Solve a Problem Using a Venn Diagram
Offer the following scenario to students.
A group of Grade 8 students from École Phélix want to sell animal accessories as part of their entrepreneurial project. In order to know the pets of the pupils of the intermediate level, they surveyed 154 pupils who have at least one animal at home. Here are the results obtained:
- 52 students have only one dog
- 36 students have only one cat
- 12 students have only one fish
- 21 students have only one dog and one cat
- 5 students have only one cat and one fish
- 2 students have a dog, a cat and a fish
- 26 students have a pet other than a dog, cat or fish
Ask students the following questions:
- What is the probability that an intermediate student will have a dog?
- What is the probability that an intermediate student will have a fish or other animal?
- What is the probability that an intermediate student has a dog or cat?
To answer the questions, have students create a Venn diagram to categorize the data according to the students' pets and highlight the relationships between them. Since there are three categories (dog, cat and fish), the diagram will have three circles. Record the number of pets in each region of the diagram afterwards.
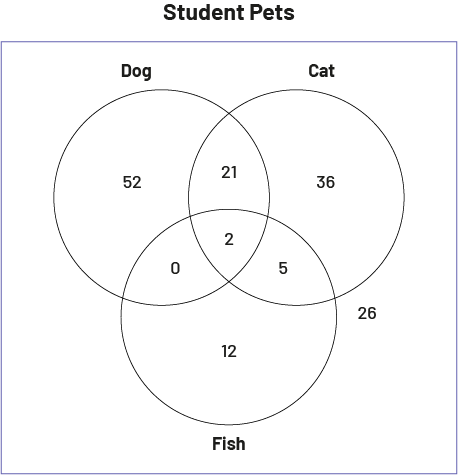 image The Venn diagram is entitled "Student Pets". The first set is called "Dog", the second set is called "Cat" and the third set is called "Fish". At the junction of the three sets is the number two. In the set exclusive to the dog, there is the number 52. In the shared dog and cat set, there is the number 21. In the shared dog and fish set, there is the number zero. In the cat-only set, there is the number 36. In the shared set cat and fish, there is the number five. In the fish-exclusive set, there is the number 12. Outside the diagram, there is the number 26.
Students can then determine the probabilities.
- The probability that a student has a dog is equal to \(\frac{75}{154}\) or 48.7%.
- The probability that a student has a fish or other pet is equal to \(\frac{45}{154}\) or 29.2%.
- The probability that a student has a dog or cat is equal to \(\frac{116}{154}\) or 75.3%.