B1. Number Sense
Demonstrate an understanding of numbers and make connections to the way numbers are used in everyday life.
Learning Situation 1: Aim Straight!
Duration: approximately 85 minutes
Summary
In this learning situation, students explore the concept of percent in the context of a game of skill.
| Overall Expectation | Specific Expectations |
|
B1. Number Sense Demonstrate an understanding of numbers and make connections to the way numbers are used in everyday life. |
B1.3 Represent equivalent fractions from halves to twelfths, including improper fractions and mixed numbers, using appropriate tools, in various contexts.
B1.7 Describe relationships and show equivalences among fractions, decimal numbers up to hundredths, and whole number percents, using appropriate tools and drawings, in various contexts. |
Learning Goals
The purpose of this learning situation is to support students to:
- understand the meaning of percent;
- make connections between fractions, decimals, and percents;
- convert a decimal number or fraction with a denominator of 100 to a percent;
- develop and use problem-solving strategies.
| Learning Context | Prerequisites |
|---|---|
| In Grade 4, students were introduced to decimal tenths and their relationship to whole numbers and fractions, in a variety of contexts. In Grade 5, they learn about decimal hundredths and percents and begin to make connections between fractions, decimal numbers, and percents. | This learning situation supports students to develop conceptual understanding percents by helping them to recognize that it is possible to represent the same quantity using a percent, a fraction, and a decimal number. To be able to complete this learning situation, students need to:
|
Materials
- small bean bags
- container (for example, basket, trash can, recycling bin)
- Appendix 6.1 (Aim Straight!) (1 copy per student)
- Appendix 6.2 (Throws from a distance of 1 metre) (1 copy per team)
- Appendix 6.3 (Throws from a distance of 2 metres) (1 copy per team)
- Appendix 6.4 (Throws from a distance of 3 metres) (1 copy per team)
- Appendix 6.5 (Throws from a distance of 4 metres) (1 copy per team)
Mathematical Vocabulary
decimal number, fraction, equivalent fractions, decimal fraction, hundredth, percent
Before Learning (Warm-Up)
Duration: approximately 30 minutes
Beforehand, place a container (for example, basket, trash can, recycling bin) at the front of the class and mark distances 1 metre, 2 metres, 3 metres, and 4 metres away from this container with masking tape, as shown below.

Explain to students that they will be exploring percents with the game Aim Straight! Explain that this game involves attempting to throw a small bean bag into a container from a specified distance. Present the chart below (Appendix 6.1) in which successful throws will be recorded as they occur. Invite:
- 5 students to make 1 throw each from the 1 metre distance;
- 10 students to make 1 throw each from the 2 metre distance;
- 20 students to make 1 throw each from the 3 metre distance;
- 25 students to make 1 throw each from the 4 metre distance.
Note: The table below provides a sample of possible results; the subsequent explanations presented are based on these results. However, teachers should always work with actual student results.
Example
| Distance From the Container | Number of Throws | Number of Successful Throws | Result Represented as a Fraction | |||
|---|---|---|---|---|---|---|
| 1 m | 5 | 4 | ||||
| 2 m | 10 | 7 | ||||
| 3 m | 20 | 13 | ||||
| 4 m | 25 | 13 |
Distribute a copy of the chart (Appendix 6.1) to each student so that they can record their results. Fill in the fourth column, Result Represented as a Fraction, together.
Ask students to compare results based on the distance from which the throws were made. Discuss how it can be difficult to compare the results, since the denominators differ from one situation to another. Ask students to write the title "Result Represented as a Fraction (in Hundredths)" in the fifth column and to determine, for each fraction in the fourth column, the equivalent fraction in hundredths.
Note: To determine a fraction equivalent in hundredths, students could use proportional reasoning. For example, 4 successful throws out of 5 throws is equivalent in number to 8 successful throws out of 10 throws (if you double the number of throws made, you double the number of successful throws), to 12 successful throws out of 15 throws made, and so on. We can continue this reasoning until 80 successful throws out of 100 throws (20 times more throws made, so 20 times more successful throws).
Example
| Distance From the Container | Number of Throws | Number of Successful Throws | Result Represented as a Fraction | Result Represented as a Fraction (in Hundredths) | ||
|---|---|---|---|---|---|---|
| 1 m | 5 | 4 | \(\frac{4}{5}\) | \(\frac{{80}}{{100}}\) | ||
| 2 m | 10 | 7 | \(\frac{7}{{10}}\) | \(\frac{{70}}{{100}}\) | ||
| 3 m | 20 | 13 | \(\frac{{13}}{{20}}\) | \(\frac{{65}}{{100}}\) | ||
| 4 m | 25 | 13 | \(\frac{{13}}{{25}}\) | \(\frac{{52}}{{100}}\) |
Then invite students to share their answers and explain their strategies. Ask questions to prompt the comparison of the fractions obtained and the strategies used. For example:
- How did you obtain the fractions in hundredths?
- Have other students used this strategy?
- Are there any who have used a different strategy?
- What are the benefits of writing the results out of 100?
- What do you think the word "percent" means?
- In what situations have you ever seen a percent? (For example, provincial and federal taxes imposed on purchases, discounted prices…)
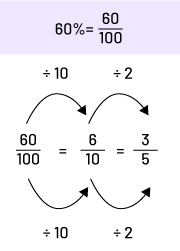
Support students to understand that the results in the fifth column, Result Represented as a Fraction (in Hundredths), can also be expressed as percents (out of 100). Point out, for example, that the fraction \(\frac{{80}}{{100}}\) expressed as a percent is written as 80% and reads as "80 percent". Have students write the title "Result Represented as a Percent" in the sixth column along with the appropriate results.
Example
| Distance From the Container | Number of Throws | Number of Successful Throws | Result Represented as a Fraction | Result Represented as a Fraction (in Hundredths) | Result Represented as a Percent | |
|---|---|---|---|---|---|---|
| 1 m | 5 | 4 | \(\frac{4}{5}\) | \(\frac{{80}}{{100}}\) | 80% | |
| 2 m | 10 | 7 | \(\frac{7}{{10}}\) | \(\frac{{70}}{{100}}\) | 70% | |
| 3 m | 20 | 13 | \(\frac{{13}}{{20}}\) | \(\frac{{65}}{{100}}\) | 65% | |
| 4 m | 25 | 13 | \(\frac{{13}}{{25}}\) | \(\frac{{52}}{{100}}\) | 52% |
Support students to recognize that \(\frac{4}{5}\), \(\frac{80}{100}\) and 80% represent the same result, which is 4 of the 5 throws. Therefore, \(\frac{4}{5}\) = \(\frac{80}{100}\) = 80%.
It is important to clarify the meaning of a percent. A successful score expressed as a percent represents the number of successful throws out of 100 trials. For example, a score of 75% means that if 100 throws are made, 75 throws are successful. However, emphasize that a percent score does not imply that exactly 100 throws were made. Any situation that can be represented by a fraction equivalent to \(\frac{75}{100}\) would be possible, for example, 15 successful throws out of 20 \(\frac{15}{20}\) or 150 successful throws out of 200 \(\frac{150}{200}\).
Then read aloud the fractions expressed in hundredths (fifth column) and ask the students what other ways they know to represent these numbers. Point out that while they have presented the results of the throws as fractions and percents, they could also have done so as decimal numbers, since these three different representations can represent the same number. Establish the relationships between a percent, a fraction with a denominator of 100, and the corresponding decimal number (for example, \(70\% \; = \;\frac{{70}}{{100}}\; = \;0.70\)).
Have students write the title "Result as a Decimal Number" in the seventh column, then fill in the corresponding results.
Example
| Distance From the Container | Number of Throws | Number of Successful Throws | Result Represented as a Fraction | Result Represented as a Fraction (in Hundredths) | Result Represented as a Percent | Result as a Decimal Number |
|---|---|---|---|---|---|---|
| 1 m | 5 | 4 | \(\frac{4}{5}\) | \(\frac{{80}}{{100}}\) | 80% | 0.80 |
| 2 m | 10 | 7 | \(\frac{7}{{10}}\) | \(\frac{{70}}{{100}}\) | 70% | 0.70 |
| 3 m | 20 | 13 | \(\frac{{13}}{{20}}\) | \(\frac{{65}}{{100}}\) | 65% | 0.65 |
| 4 m | 25 | 13 | \(\frac{{13}}{{25}}\) | \(\frac{{52}}{{100}}\) | 52% | 0.52 |
Active Learning (Exploration)
Duration: approximately 35 minutes
Introduce the rest of the learning situation.
To make the game of skill more interesting, we will impose the following constraints:
- some of the throws made at a distance of 1 metre from the container will be made over the shoulder facing backwards;
- some of the throws made at a distance of 2 metres from the container will be made using the left hand if you are right-handed and with the right hand if you are left-handed;
- some of the throws made at a distance of 3 metres from the container will be made while standing on one leg;
- some of the throws made at a distance of 4 metres from the container will be made with one eye closed.
Before executing the throws, you need to do some calculations.
Group students in pairs. Distribute a copy of Appendices 6.2, 6.3, 6.4 and 6.5 to each team. Explain the task to them using Appendix 6.2.
Explain that of the five throws made at a distance of 1 metre from the container, 60% must be made facing backwards. Tell them that they must:
- determine the number of throws to be made according to the constraint;
- estimate the percentage of successful throws, using an estimation strategy of their choice.
Ask students to complete the assignment (Appendices 6.2, 6.3, 6.4 and 6.5), making sure to address the constraint in each situation. Explain that students should keep a record of their work so that they can share their reasoning during a mathematical discussion.
Sample Student Response
| Distance From the Container | Number of Throws | Percentage of Throws Required Using the Constraint | Decimal Number Representing the Throws With the Constraint | Fraction of Throws With the Constraint | Number of Throws With the Constraint | Estimated Rate of Success (Percent) |
|---|---|---|---|---|---|---|
| 1 m | 5 | 60% | 0.60 | \(\frac{{60}}{{100}}\) | 3 | 70% |
Justify the estimated percent rate of success with explanations, drawings or calculations.
The percentage of successful throws made at a distance of 1 metre during Warm-Up was 80%. With the constraint, it should be lower. Therefore, I estimate that the rate of success will be about 70%.
| Possible Observations | Possible Interventions |
|---|---|
| One team does not know how to convert 60% into a fraction. | Pose questions such as:
|
| A team cannot determine how many of the five throws have to use the constraint. | Model proportional reasoning. Explain, for example, how 60 throws out of 100 is equivalent to 30 throws out of 50 by discussing how 30 is half of 60 and 50 is half of 100. Then ask them:
|
| One team does not understand what needs to be done to complete the last column. | Remind them that during the Warm-Up, 4 of the 5 throws made at a distance of 1 metre were successful, which corresponds to 80%. Tell them that they must now estimate a reasonable rate of success, as a percent, taking into account the constraint. |
| A team does not know how to convert \(\frac{1}{5}\) to a percent. | Ask students to determine fractions equivalent to \(\frac{1}{5}\) (for example, \(\frac{2}{{10}}\), and \(\frac{4}{{20 }}\)). Then ask them what a percent represents in order to show that it can be represented by a fraction with a denominator of 100. |
Consolidation of Learning
Duration approximately 20 minutes
Ask a few teams to present the strategy they used to complete the table for throws made at a distance of 1 metre, as well as to justify their estimation.
During the math conversation, the choice of teams is very important since it is through the sharing of ideas that students will compare their strategies for converting between a percent, a decimal number and a fraction. This sharing will help to solidify their learning.
After each presentation, encourage other students to add to the math conversation of ideas by asking questions and making relevant observations. If necessary, assist them by asking questions such as:
- Is this an effective strategy? Why is it effective?
- How would you explain in your own words the strategy that was just presented?
- How have other students used a strategy like this one?
- How else could results have been determined?
- Is this estimation reasonable? Why or why not?
- Did anyone get the same estimation using different reasoning?
- What other estimations were there?
Then, invite five students to throw from the point located 1 metre from the container according to a new instruction. Ask three students to throw with a constraint and two to throw without a constraint. Determine the percent of success and compare it to the percent of success estimated by the students.
Repeat the same procedure for the other three series of throws (Appendices 6.3, 6.4 and 6.5).
In the math discussions, emphasize the meaning of a percent and highlight various conversion strategies:
- converting a fraction to a decimal (for example, \(\frac{2}{5}\; = \;\frac{4}{{10}}\; = \;0.4\) or \( 2\;\div\;5\;=\;0.4\));
- converting a decimal number to a decimal fraction (for example, 0.45 = \(\frac{45}{100}\) 0.7 = \(\frac{7}{10}\) );
- convert a fraction to a percent (for example, \(\frac{3}{5}\; = \frac{6}{{10}}\; = \frac{60}{100} = \;60\% \) or \(3\; \div \;5\; = \;0.60\; = \;60\% \));
- converting a percent to a decimal fraction (for example, \(5\% \; = \;\frac{5}{{100}}\); \(77\% \; = \frac{{77}}{{100}}\)).
Differentiated Instruction
The activity can be modified to meet the needs of the students.
| To Simplify the Task | To Enrich the Task |
|---|---|
| Change the constraint to provide the team with the number of throws instead of a percent and focus on conversion strategies.
Example Tell students that of the 5 throws made at a distance of 1 metre from the container, 3 must be made over the shoulder facing backwards. Ask students to determine what percentage of the total number of throws this represents. |
Ask students to award points for each successful Aim Straight! throw based on the distance from which it is made. The goal is to have a score of approximately 200 points after 10 throws at each of the distances.
Example A student might suggest that 28 points be awarded for each successful throw made 2 metres from the container, explaining that in Warm-Up, 70% of the throws were successful, or 7 out of 10 throws, and that 7 times 28 = 196 points. They would have the same reasoning for the other 3 distances. |
Follow-Up at Home
Suggest that students invent a game of skill (for example, knocking over a bowling pin by rolling a ball) and invite family members to participate. Specify the number of trials (5, 10, 20, 25 or 50) to obtain fractions that can be easily converted into percents. Have them compile the results in a table similar to the one used in Warm-Up.
The next day, have them present their game and invite their peers to play. Once they have completed a data table, ask them to compare the rate of success as a percent with the results they obtained at home.
Source: translated from Guide d'enseignement efficace des mathématiques de la 4e à la 6e année, Numération et sens du nombre, Fascicule 3, Nombres décimaux et pourcentages, p. 165-175.
Learning Situation 2: The Fractions Picnic
Duration: 1 hr 40 min
Summary
In this learning situation, students use mixed numbers and improper fractions to compare quantities of sandwiches.
| Overall Expectation | Specific Expectations |
|
B1. Number Sense Demonstrate an understanding of numbers and make connections to the way numbers are used in everyday life. |
B1.3 Represent equivalent fractions from halves to twelfths, including improper fractions and mixed numbers, using appropriate tools, in various contexts.
B1.4 Compare and order fractions from halves to twelfths, including improper fractions and mixed numbers, in various contexts. |
Learning Goals
The purpose of this learning situation is to enable students to:
- develop a sense of a quantity represented with improper fractions and mixed numbers;
- recognize the relationship between related concepts and equivalent representations of the same quantity (improper fraction, mixed number, equivalent fractions, symbolic representations, visual (semi-concrete) representations, fraction as a division, and fraction as a part of a whole);
- develop and use problem solving strategies.
| Learning Context | Prerequisites |
|---|---|
| In previous grades, students gained an understanding of the concept of a fraction by exploring fractions that represent a quantity less than a whole, that is, proper fractions (for example, \(\frac{5}{8}\) ). In Grade 5 , students deepen their understanding of this concept by exploring fractions that represent a quantity greater than the whole, that is, improper fractions (for example, \(\frac{5}{3}\)) or mixed numbers (for example, \(1\frac{1}{3}\) ). They also study the concept of equivalent fractions. | This learning situation allows students to develop a sense of the quantity represented by a mixed number or by an improper fraction in a problem solving context. It also supports building connections between proper fractions, improper fractions, mixed numbers and whole numbers as well as between various representations (symbolic, visual, concrete).
To be able to complete this learning situation, students must:
|
Mathematical Vocabulary
fraction, numerator, denominator, part of a whole, division, proper fraction, improper fraction, mixed number, integer, equivalent fractions
Materials
- Appendix 5.1A (School Picnic - Part 1) (1 copy per team)
- Appendix 5.1B (School Picnic - Part 2) (1 copy per team)
- Appendices 5.2A and 5.2B (Solutions)
- Appendix 5.3 (Students' explanations)
- markers
- large sheets of paper (1 per team)
- interactive whiteboard
Before Learning (Warm-Up)
Duration: 15 minutes
The purpose of this warm-up is to enable students to represent a quantity using a mixed number and an improper fraction. Present the following situation, then complete a table like the one below:
On the menu at a class picnic, there were small pizzas cut into 4 equal pieces. A student ate one piece of pizza. What fraction of a pizza did he eat? (\(\frac{1}{4}\) of a pizza)
He then ate a 2nd piece. What fraction of a pizza did he eat in total? (\(2 \times \frac{1}{4}\) of a pizza or \(\frac{2}{4}\)); students will probably say \(\frac{1}{2}\) a pizza)
Then he ate a third piece. What fraction of a pizza did he eat in total? (\(3 \times \frac{1}{4}\) of a pizza or \(\frac{3}{4}\) of a pizza)
Then he ate a 4th. How much pizza did he eat in total? (4 times \(\frac{1}{4}\) of a pizza, \(\frac{4}{4}\) of a pizza or 1 whole pizza)
Finally, he ate a 5th piece of pizza. How much of a pizza did he eat in total? (5 times \(\frac{1}{4}\) of a pizza, \(\frac{5}{4}\) of a pizza or \(1\frac{1}{4}\) of a pizza)
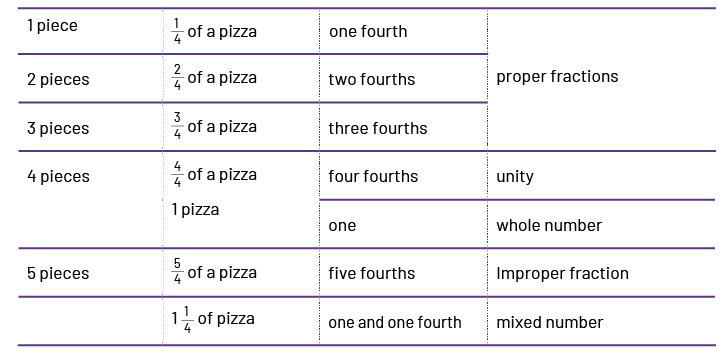
Point out that for the fractions \(\frac{1}{4}\), \(\frac{2}{4}\) and \(\frac{3}{4}\), the numerators are less than the denominators, so these are called proper fractions. However, it is not essential that the numerator of a fraction be less than the denominator. Explain that a fraction whose numerator is greater than its denominator is called an improper fraction and that it represents a quantity greater than one whole. For example, in this situation, when the student ate 5 pieces of pizza in total, we wrote \(\frac{5}{4}\) of a pizza. The fraction \(\frac{5}{4}\) is pronounced "5 fourths" and it means \(\frac{1}{4}\; + \;\frac{1}{4}\; + \;\frac{1}{4}\; + \;\frac{1}{4}\; + \;\frac{1}{4}\; = \;5\; \times \;\frac{1}{4}\; = \;\frac{5}{4}\). Just as \(\frac{2}{4}\) means 2 parts of a whole split into fourths \(\frac{5}{4}\). \(\frac{5}{4}\) means 5 parts of a whole that has been split into fourths.
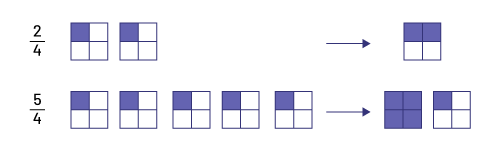
Explain that a quantity greater than the whole can also be represented by a mixed number. Specify that \(1\frac{1}{4}\) is read "1 and 1 fourth", that the number 1 represents the number of wholes and that the fraction \(\frac{1}{4}\) represents the fractional part of an equivalent whole. In this situation, the student has therefore eaten a whole pizza (\(\frac{4}{4}\) of pizza) and \(\frac{1}{4}\) of another pizza of the same size.
Specify that the improper fraction \(\frac{5}{4}\) and the mixed number \(1\frac{1}{4}\) are two ways of representing the same quantity. At this stage, it is important to simply present the terminology of these types of numbers without focusing on their connections since students will explore them a little later in this learning situation.
Briefly review the concept of equivalent fractions, pointing out that these are different ways of representing the same quantity. For example, mention that \(\frac{2}{4}\) of sandwich is equivalent to \(\frac{1}{2}\) of sandwich, that \(\frac{1}{3} \) of sandwich is the equivalent of \(\frac{2}{6}\) or \(\frac{4}{{12}}\) of sandwich and show how we can confirm that they represent an equivalent amount.
Read the scenario outlined on Appendix 5.1A, and explain the task, which is to determine if each member of each group received an equal distribution of sandwiches.
Ensure that students have understood the task by asking questions such as:
- Who would like to explain the situation in your own words? What happened at the picnic?
- Why might we think each student did not receive the same amount?
- Who can explain the task in their own words?
- What is a mixed number?
- What is an improper fraction?
Active Learning (Exploration)
Duration: 55 minutes
Group students in pairs and distribute a copy of Appendix 5.1A. Have them complete the task using the strategies of their choice.
Allow sufficient time for students to discuss and solve the problem. Circulate and observe the strategies used. Provide support as needed.
Ask students to keep track of their reasoning and to write the number of the corresponding statement next to their calculations and illustrations. See Appendix 5.2A for a solution.
Typically, in order to complete the task, students first illustrate each statement, representing the corresponding quantity. This quantity is then expressed symbolically by an improper fraction, then by a mixed number. Their strategy is refined as they progress through the learning task and as they develop the sense of quantity represented by the improper fraction and by the mixed number. Since comparing quantities is related to equivalence, they must also recognize that certain statements lead to the use of equivalent fractions (for example, \(1\frac{4}{6}\; = \;1 \frac{2}{3}\)).
| Possible Observations | Possible Interventions |
| After reading Statement 2, a team tries to determine the number of people in the group instead of looking for the quantity of sandwiches received. | Ask questions such as:
What do you need to determine? For this, is it necessary to know the number of people in the group? |
| A team does not recognize that \(\frac{4}{6}\; = \;\frac{2}{3}\). | Ask questions such as:
|
A team represents Statement 1 as a fraction of a whole, while the situation describes a fraction of a set. Also, they don't know how to divide the remaining 4 sandwiches.

|
Ask questions such as:
|
When students have almost completed Part 1 of the assignment, distribute Appendix 5.1B to each team. Explain that Part 1 allowed them to explore mixed numbers and improper fractions and that Part 2 will deepen their understanding of these concepts.
Suggest that students examine their representations in Part 1 to determine possible calculations to solve the problems rather than using drawings to illustrate the statement. Add that they can use the drawings if desired.
Note: The aim here is to allow students to move from visual representations toward the reasoning that underlies the mathematical operations. However, the goal is to not present an algorithm or set of steps to be followed, but rather to allow students to establish connections between the meaning of the problem, the numbers involved, and the reasoning they imply. In this sense, Appendix 5.2B presents elements of a solution.
Circulate, observe, and select the teams who will present during the mathematical discussions that follow. Choose solutions based on their strengths or what can be learned from them.
Once their work is completed, assign one or two problems from the learning situation to each team that they will present to the rest of the class. Provide them with large sheets of paper and markers, and allow them sufficient time to prepare for the math discussion. Specify that they must present the reasoning or strategies used to solve the assigned problem.
Consolidation of Learning
Duration: 30 minutes
Invite the selected teams to present their strategies. Ensure that each team identifies the statement being presented by number, by reading it aloud, or by writing it on the board. Invite students to intervene and add comments.
Facilitate the discussion by asking questions.
For example
- How can we explain this team's approach?
- Which other teams have you seen who used this or a similar strategy?
- These two teams express different answers for the same problem. How is this possible? (Show the equivalence of the various representations: the equivalent fractions as well as the equivalence between the mixed number and the improper fraction.)
- To solve the problem in Statement 1, why did they divide by 6?
- How did you go about finding the quantity of Abdul's group even though the number of people in it was not mentioned?
- What do they mean by "we have done the division" when we are talking about a fraction?
- Why do you say that \(1\frac{4}{6}\) is equivalent to \(1\frac{2}{3}\)?
- Some groups speak mainly of sixths while others refer to thirds. What is the difference?
- In order to solve the cantaloupe problem, why are you talking about multiplication, division and remainder?
- What is the difference between Amon's statement ("Each member of the group received five thirds of a sandwich.") and Abdul's statement ("It was delicious. There were 8 sandwiches for John, Peter and me.")? [Point out that the first statement presents the fraction as part of a whole sandwich \(\frac{5}{3}\) while the second presents a sharing situation (8 sandwiches for 3 people: so 8 ÷ 3 can be represented by \(\frac{8}{3}\)
Encourage students to use clear arguments and precise vocabulary. Appendix 5.3 provides examples of student reasoning, mathematical arguments, and solution strategies.
Highlight effective strategies for converting an improper fraction into a mixed number and vice versa by establishing connections between visual (semi-concrete) representations and the meaning of the numbers that compose them (the wholes, the fractional parts, the division, the remainder ). It is more important for students to understand the meaning of numbers and the operations performed than to memorize the steps to follow.
Differentiated Instruction
The activity can be modified to meet the needs of the students.
| To Simplify the Task | To Enrich the Task |
|
|
Follow-Up at Home
At home, students can use concrete and visual (semi-concrete) representations to solve one or two problems related to mixed numbers and improper fractions.
Examples of problems
- If the rectangle below corresponds to \(\frac{5}{4}\) of a whole, draw the whole.

- Seven times during his training for a bicycle race, Peter covers one fourth of the total route. The odometer on his bicycle indicates that he has ridden a total of 14 km. How long is the race's route?

- Knowing that on \(1\frac{2}{3}\) of a sheet of stickers there are 35 stickers, how many stickers are there on the whole sheet?
- I have three small strips of paper of the same length. When I place two of the strips end to end and \(\frac{2}{3}\) of the third strip, I get a strip of paper measuring 240 cm. How long is one of the small strips?

- After a party, there are two whole rectangular cakes and part of a third. How many cakes are left?

Source: translated from Guide d'enseignement efficace des mathématiques de la 4e à la 6e année, Numération et sens du nombre, Fascicule 3, Nombres décimaux et pourcentages, p. 147-157.
Learning Situation 3: The Theatre Room
Total Duration: 85 minutes
Summary
In this learning situation, students use a variety of strategies to estimate the number of spectators a venue can hold. They then approximate the profit or loss generated by a sold-out show.
| Overall Expectation | Specific Expectations |
|
B1. Number Sense Demonstrate an understanding of numbers and make connections to the way numbers are used in everyday life. |
B1.1 Read, represent, compose, and decompose whole numbers up to and including 100 000, using appropriate tools and strategies, and describe various ways they are used in everyday life.
B1.2 Compare and order whole numbers up to and including 100 000, in various contexts. Note: This situation connects with expectation B2 (Operations). |
Learning Goals
The purpose of this learning situation is to have students:
- develop a sense of large numbers in a real-life context;
- apply estimation and calculation strategies;
- verify the reasonability of the result of a calculation;
- establish a connection between rounding and estimating.
| Learning Context | Prerequisites |
|---|---|
| In previous grades, students have learned to compare, order, and represent whole numbers up to 10 000. They have estimated the results of various mathematical operations, including operations involving amounts of money. In Grade 5 , they further develop these skills to build an understanding of quantities represented by larger whole numbers (up to 100 000). | This learning situation provides students with the opportunity to develop their estimating skills by applying a variety of appropriate strategies.
To be able to complete this learning situation, students must:
|
Mathematical Vocabulary
estimation, rounding, more than, less than, about, between, approximation
Materials
- Appendix 5.1 (Theatre Room) (1 copy per team)
- Appendix 5.2 (Floor Plan) in large format (1 copy per team)
- large sheets of paper (1 per team)
- felt-tip pens
- glue sticks
Before Learning (Warm-Up)
Duration: approximately 15 minutes
Ask students if they have ever attended a show, play, concert, or large gathering. If so, ask if they remember the approximate number of people in the audience. Discuss with them if they simply guessed the number or if they used an estimation strategy.
Review the words estimation, rounding, more than, less than, about, between, approximate.
Present the following scenario to students:
A theatre company would like to rent a large room to perform their new play. The company's management must determine the price of tickets. After discussion, company members suggested that the price be set at $19.75 per ticket.
Share Appendix 5.2 with students just long enough to given them a sense of the size of the room, but not enough time for them to count seats.
Ask them to write down the number of seats they think the room contains. Later, during the follow-up discussion, they can compare this number with a number they obtain using an estimation strategy. This comparison serves to reaffirm the benefits of knowing and using such strategies, especially when dealing with large numbers.
Note: The number of seats in the room is not specified. It is important in this situation to focus on estimating and the strategies that can be used to make an estimation.
Display Appendix 5.1 on the interactive whiteboard or on a large sheet of paper and present the following problem to students.
The theatre company would like to rent the room I just showed you to perform their play. They are budgeting $22 230 for all expenses related to this performance including hall rental, lighting, sound, and program. If the company's management accepts the suggestion to set the price of a ticket at $19.75 and if all the tickets are sold, will the company make a profit? If so, approximately what will it be? If not, how much will the loss be?
Ensure that students understand the problem by asking them to explain in their own words the situation and the meaning of the terms profit and loss.
Note: It is important not to direct students too much; they should be allowed to find personal problem-solving and estimation strategies.
Active Learning (Exploration)
Duration: approximately 40 minutes
Group the students in pairs.
Distribute a copy of Appendix 5.1 and Appendix 5.2 to each team. Ask them to solve the problem, leaving a record of their work. Let them know that they can write on the plan. To encourage students to round, do not allow the use of a calculator during the exploration.
Observe students and support them in their work, but do not tell them how to meet the challenge.
They must be supported, through strategic interventions, to think about:
- the strategies to be used to solve the problem;
- a reasonable approximation of the number of seats.
Allow sufficient time for students to explore and discuss various problem-solving strategies.
Circulate among students and provide support by asking questions such as:
- How can you represent this situation differently? How can using another representation help you solve the problem?
- Is this quantity reasonable?
Students will choose various strategies to solve the problem. Examples of strategies they might use to estimate the total number of seats:
- using symmetry (for example, estimating the number of seats in half the room, then doubling that number);
- marking off sections that form an array and estimating the number of seats in each;
- counting, for each section, the average number of seats in a row and multiplying that by the number of rows;
- rounding numbers to simplify calculations;
- establishing a correspondence between a linear measurement on the plan and the number of seats (for example, 1 cm corresponds to 5 seats).
Note: When performing calculations to determine whether or not there is a profit, students are dealing with large numbers; it is therefore important to promote the use of personal algorithms. Recall the importance of checking whether the answer is reasonable.
| Possible Observations | Possible Interventions |
| One team doesn't know what to do with the numbers in the boxes on the floor plan. | Ask questions such as:
|
| One team tries to count the seats 1 by 1. | Pose questions such as:
|
| One team has difficulty performing calculations using standard algorithms. | Pose questions such as:
|
| One team estimated the number of seats at 2355 and got an answer that is not reasonable (for example, \(\$19.75\; \times \;2355\;=\;\%90\;636\). | Pose questions such as:
|
To prepare students for group sharing and discussion, distribute a large sheet of paper and an enlarged floor plan to the teams. Ask them to glue the map to the middle of the large sheet and to record their calculations on the sheet. Remind them that they must be prepared to explain their estimation strategies and to justify their choices with clear and convincing mathematical arguments.
Select the teams who will present. Choose based on the differences in estimation and calculation strategies (for example, two teams with a similar estimation but one who used symmetry and one who used an array). It may also be useful to include a team whose strategy did not lead to the expected results provided the focus of the discussion is on a constructive analysis of why that strategy was less effective given the scenario.
Consolidation of Learning
Duration: approximately 30 minutes
First, ask some of the selected teams to take turns presenting the strategy they used to estimate the number of seats the room contains. Encourage students to provide specific justifications using clear and convincing mathematical arguments. For example, "Since the top 3 sections, without the dressing rooms, contain about the same number of seats, we estimated the number of seats in a section and multiplied it by 3.
In discussions, it is important to highlight the different estimation strategies used and compare them by asking questions such as:
- Why does your estimation strategy work?
- Would this strategy work with a different floor plan?
- How have other teams used a similar strategy?
- What other strategies would achieve similar results?
- Which strategy do you think is most effective? Why?
- Are there large differences between the estimations obtained by different teams? (Point out that despite the diversity of strategies used, several teams obtained very similar and equally valid estimations.)
Then ask members of the selected teams to reveal the number of seats they wrote down on a piece of paper when they first saw the floor plan. To encourage all students to think about the difference between the reasonableness of a quantity obtained by guessing and the reasonableness of a quantity obtained by estimating, ask questions such as:
- When you first saw the plan, what number did you write on your piece of paper? Was this number an estimation? (It was not an estimation because the time allotted did not allow for a proper estimation to be obtained.)
- Is a quantity obtained by estimating more reasonable than a quantity obtained by guessing? Why? (Yes, a quantity obtained by estimating is generally more reasonable because it is not random; it is based on a quick, but thoughtful calculation.)
Second, ask the other selected teams to present the calculations they made to determine whether the theatre company will make a profit or a loss. Emphasize the different calculation strategies used and how to check the reasonableness of their answers. Emphasize the importance of rounding numbers to make the calculations easier.
Ask questions such as:
- How did you determine whether the company will make a profit or a loss?
- Why did the teams get different answers? Is this acceptable?
- How do you know your answer is reasonable?
- Is the theatre company likely to experience a greater or lesser profit (or loss) than the amount you have determined?
- What might be a good reason for using rounding in this scenario?
Throughout the discussion, invite other students to respond to each presentation and share their observations. If necessary, ask them questions such as:
- How can we use rounding and estimation to make calculations easier?
- In what type of context is it okay to estimate?
- In what contexts might we round up?
- What would you write about estimating versus guessing in a math journal (group or personal)?
Ensure that students understand that it is acceptable to estimate and round in contexts where an approximate, not an exact, answer is sought.
To consolidate estimation strategies, take students to a building in their community that can accommodate a large number of people (for example, arena, theatre, church) and ask them to estimate the number of seats. This exercise can also be done using a virtual tour of a theatre or concert hall on the Internet.
Differentiated Instruction
The activity can be modified to meet the needs of the students.
| To Simplify the Task | To Enrich the Task |
|
|
Follow-up at Home
At home, students can:
- design a floor plan of an auditorium on graph paper and determine the exact number of seats it contains;
- print out a floor plan of a venue obtained from an Internet search and note the number of seats it contains.
Back at school, students will exchange their floor plans. They would first estimate the number of seats in the room from the plan they were given. Then they compare their estimation with the actual number to determine if it was a reasonable estimation.
Extension - Another Perspective
Distribute a photo showing a large number of objects, animals, or people (for example, a photo of a flock of birds, a field of corn plants, bees around a hive, a crowd) and ask students to estimate this quantity. The photo can be obtained from the Internet.
Since the photos provide a 3-dimensional perspective, objects in the foreground appear larger than those in the background. Students are likely to use different estimation strategies than those used in the learning situation. Encourage them to describe and justify their choice of strategy.

Source: translated from Guide d'enseignement efficace des mathématiques de la 4e à la 6e année, Numération et sens du nombre, Fascicule 1, Nombres naturels, p. 181-189, 191-193.