C1.2 Create and translate repeating and growing patterns using various representations, including tables of values and graphs.
Activity 1: Decorative Strip (Representing a Pattern)
A decorative strip for a wall is created using wooden strips of equal lengths forming a shape that is repeated several times. All shapes are glued together.
The table of values below shows the quantity of wooden strips required for one shape, 2 shapes, 3 shapes, 4 shapes, and 5 shapes.
| Terms, t | 1 | 2 | 3 | 4 | 5 |
|---|---|---|---|---|---|
| Strips, s | 7 | 14 | 21 | 28 | 35 |
Allow students to represent the situation using the strategy of their choice.
Examples
Representing the situation with words
The growing pattern can be described as follows:
If there is 1 shape to create the decorative strip, this one is composed of 1 group of 7 strips.
If there are 2 shapes to create the decorative strip, this one is composed of 2 groups of 7 tabs, that is 14 strips.
If there are 3 shapes to create the decorative strip, this one is composed of 3 groups of 7 strips, that is 21 strips.
If there are 4 shapes to create the decorative strip, this one is composed of 4 groups of 7 strips, that is 28 strips.
If there are 5 shapes to create the decorative strip, this one is composed of 5 groups of 7 strips, that is 35 strips.
Students may also notice that the regularity rule of the pattern is that the number of tabs increases by 7 from one shape to the next.
Representing the situation with a graphical representation
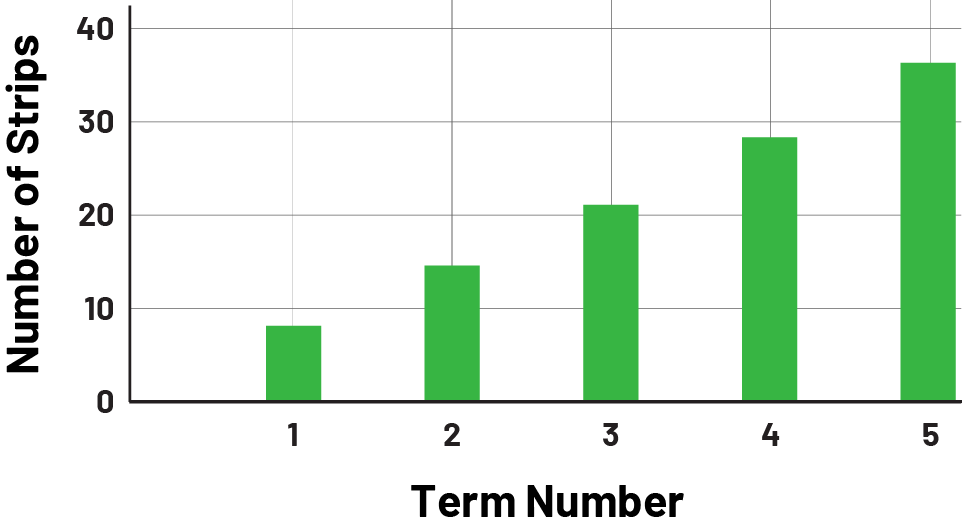 Image Graphic representation of the amount of each shape « s » and the number of tabs « n ». shape one: 7 tabs. shape 2: 14 tabs. shape 3: 21 tabs. shape 4: 28 tabs. shape 5: 35 tabs.
Representing a situation using a diagram
 Image A representation image of semi-concrete material of “X”, and number of shapes “s”, and number of tabs “n” Term one: 7 “X”. Term 2: 14 “X” Term 3: 21 “X” Term 4: 28 “X” Term 5: 35 “X”
Source: translated from L’@telier – Ressources pédagogiques en ligne (atelier.on.ca).
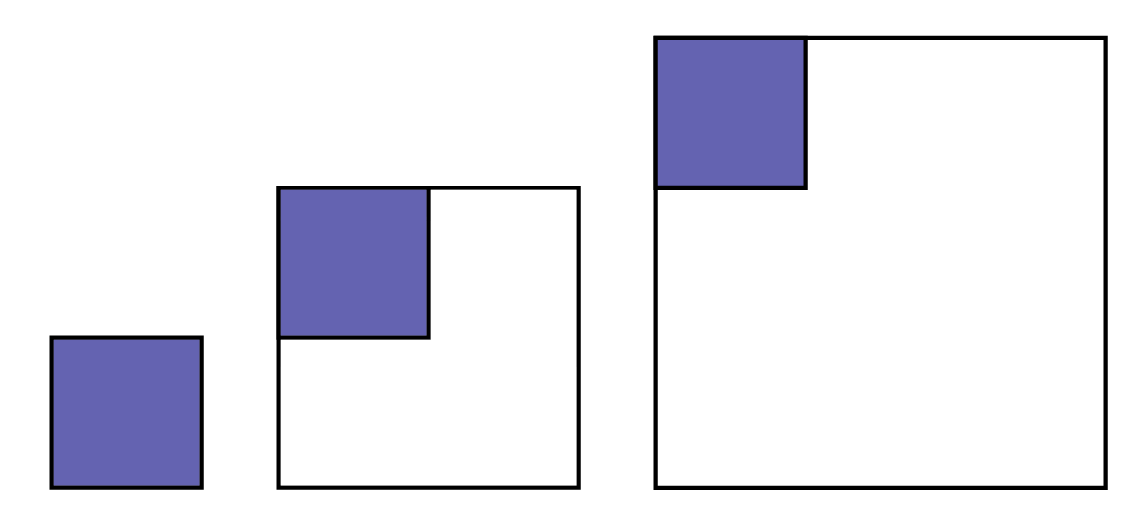
Activity 2: The Growing Square (Representing Patterns)
Ask students to examine the pattern below and represent it using a table of values and a graph.
Source: translated from L’@telier – Ressources pédagogiques en ligne (atelier.on.ca).