C1.3 Determine pattern rules and use them to extend patterns, make and justify predictions, and identify missing elements in repeating, growing, and shrinking patterns.
Skill: Determining and Using Rules to Extend Patterns, Making and Justifying Predictions, and Finding Missing Elements
Describing pattern rules in everyday language is an important step in the development of algebraic thinking.
Patterns can be described using functional thinking and recursive thinking. Describing the relationship between the term number and the term value is functional thinking. For example, each term has a value that is twice its term number. Recursive thinking can be used to make near predictions. Functional thinking tends to be used to make far predictions, such as what is the 25th term?
Example 1
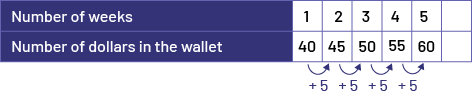
Dominic is saving up to buy a video game that costs $74.25 (including taxes). However, he only has $35 in his wallet. Every week, his parents give him $5, which he keeps in his wallet. The relationship between the number of weeks that pass and the number of dollars in Dominic's wallet can be represented by a table of values.
| Number of Weeks | 1 | 2 | 3 | |||
|---|---|---|---|---|---|---|
| Amount of Money in Dominic's Wallet | 40 | 45 | 50 |
How much money will Dominic have in his wallet after 5 weeks if he spends nothing?
Recursive Pattern Rule Involving Addition
The relationship between the number of dollars in Dominic's wallet from week to week can be represented by a table of values. Each term increases by a value of 5.
The pattern rule is +5.
I extended the value table and determined that he will have $60 after 5 weeks.
Functional Relationship
The relationship between the number of weeks passed and the amount of money in the wallet can be represented using words.
On week 1, Dominic has $35 and 1 $5 bill in his wallet, which gives him $40.
On week 2, Dominic has $35 and 2 $5 bills in his wallet, giving him $45.
On week 3, Dominic has $35 and 3 $5 bills in his wallet, giving him $50.
On week 4, Dominic has $35 and 4 $5 bills in his wallet, giving him $55.
On week 5, Dominic has $35 and 5 $5 bills in his wallet, giving him $60.
Example 2
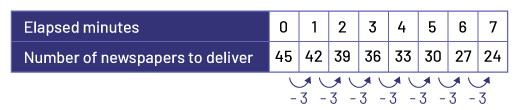
A student has to deliver 45 newspapers in their neighborhood. The following table of values represents the relationship between the number of minutes elapsed since the start of the delivery and the number of newspapers that are left to deliver.
| Number of Elapsed Minutes | 0 | 1 | 2 | 3 | 4 |
|---|---|---|---|---|---|
| Number of Newspapers to be Delivered | 45 | 42 | 39 | 36 | 33 |
How many newspapers are left to deliver after 7 minutes? Explain your answer.
Recursive Pattern Rule Involving Subtraction
I found there are 3 less newspapers to deliver every minute. This means that the student delivers 3 newspapers every minute. I extended the table of values using this pattern rule, which allowed me to conclude that after 7 minutes, 24 newspapers are left to be delivered.
Example 3
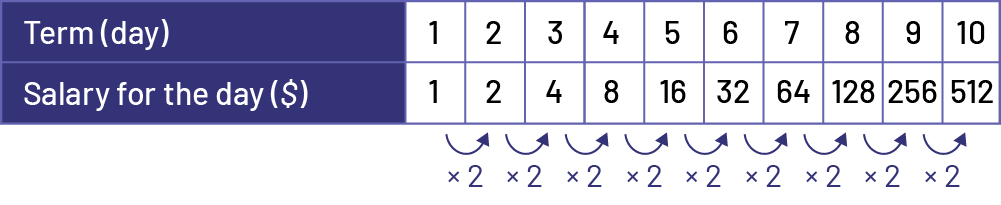
Emily babysits regularly. A couple asks her to look after their child for 6 hours a day for 10 days and offers to pay her according to the following table of values.
| Term Number (Day) | 1 | 2 | 3 | 4 | … |
|---|---|---|---|---|---|
| Salary for the Day ($) | 1 | 2 | 4 | 8 | … |
If she accepts the offer, how much money will Emily earn in total?
Recursive Pattern Rule Involving Multiplication
I noticed that the salary doubles every day. I extended the table of values to 10 days. I then added up the wages and found that Emily would earn a total of $1,023 for 10 days of babysitting.
Source: translated from Guide d’enseignement efficace des mathématiques de la 4e à la 6e année, Modélisation et algèbre, p. 35-37.
Example 4
In this soccer tournament, there are 64 teams present. On the first day, all the teams play a game and if any team loses they are eliminated. On the second day, the remaining 32 teams play a game and again the losing teams are eliminated. The same process is followed on each subsequent day.
Construct a table of values that represents the relationship between the term (day) and the number of teams playing a game on that day.
Recursive Pattern Rule Involving Division
I noticed that the number of teams playing a game decreases by half each day. The pattern rule is therefore ÷ 2.
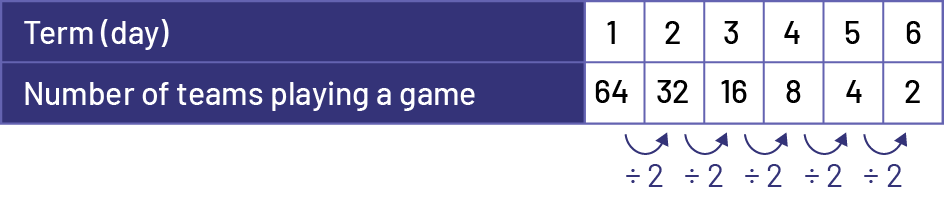
On what day will the last game take place?
The last game will be played during the 6th day.
Source: translated from Guide d’enseignement efficace des mathématiques de la 4e à la 6e année, p. 35-37.
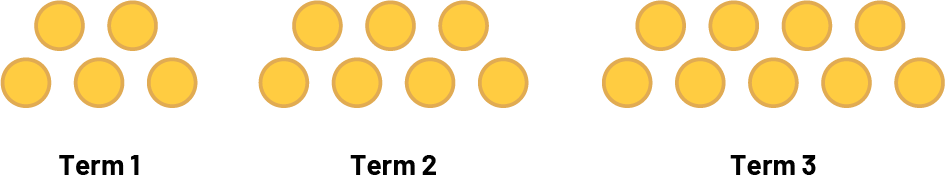
It is important to recognize that the path to the expression of a matching rule may differ from person to person, since reasoning develops from individual perceptions. The example below, inspired by research conducted by Radford ("Algebraic thinking and the generalization of patterns: a semiotic perspective", in J. L. C. S. Alatorre, M. Sáiz, A. Méndez (Eds.), Proceedings of the 28th Conference of the International Group for the Psychology of Mathematics Education, North American Chapter, vol. 1, Mérida, Mexico, 2006, pp. 2-21, as cited in Ontario Ministry of Education, A Guide to Effective Instruction in Mathematics, Grades 4-6: Modeling and Algebra, 2008, p. 54), illustrates how students may perceive the relationship between the term number and the term value (number of circles).
Example 1
Continuing the analysis, the student determines that the figure in the 10th position will contain (10 + 1) + (10 + 2) circles, or 23 circles.
Note: Students may present their interpretation using a chart.
| Term number | Number of Circles | Explanation using the Recursive Relationship | Explanation using the Functional Relationship |
|---|---|---|---|
| 1 | 5 | 5 | 5 + 0 x 2 |
| 2 | 7 | 5 + 2 | 5 + 1 x 2 |
| 3 | 9 | 5 + 2 + 2 | 5 + 2 x 2 |
| 4 | 11 | 5 + 2 + 2 + 2 | 5 + 3 x 2 |
| 25 | ? | 5 + 2 + 2 + 2 + ... | 5 + 24 x 2 |
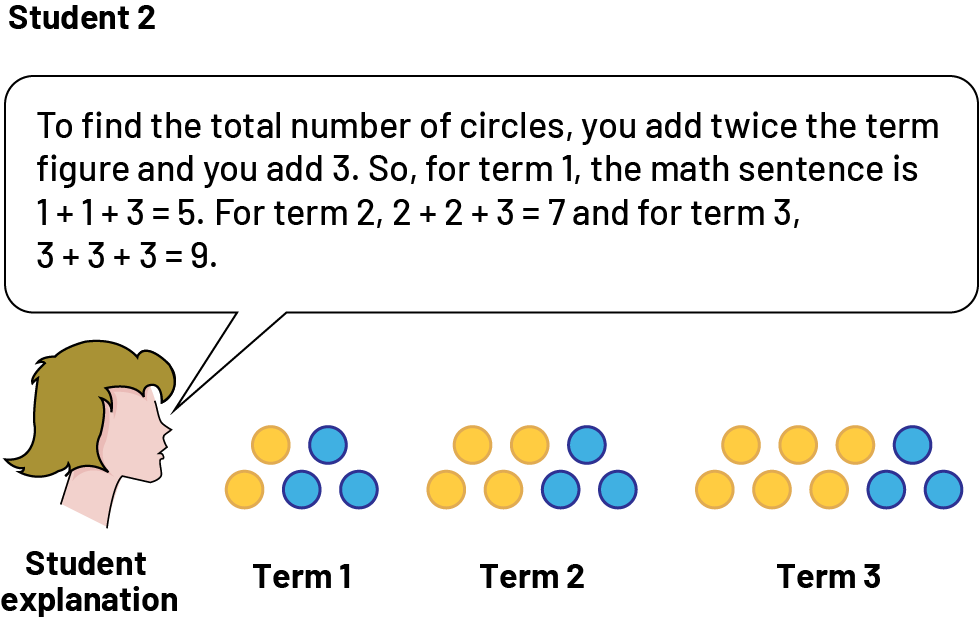
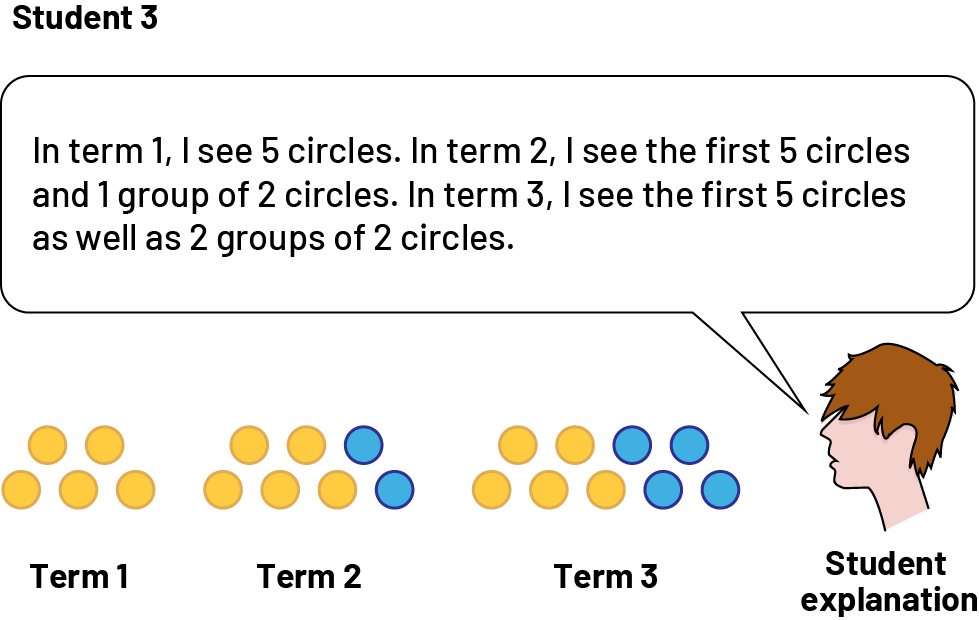
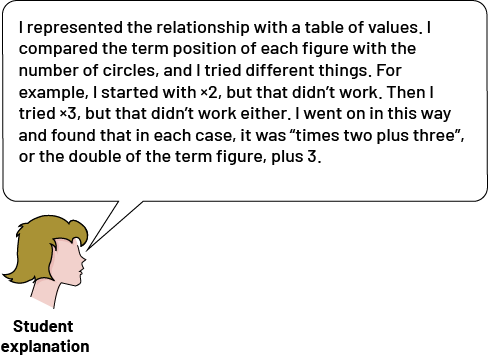
The pattern rules formulated by the three students came from their understanding of this relationship. Each student has perceived and generalized the situation in his or her own way, resulting in three rules expressed in different, but equivalent, words. None is better than the other. They do, however, demonstrate that students' interpretation of a relationship has an effect on the pattern rule they formulate. It is important for teachers to encourage these different formulations of a pattern rule.
There may be students who move too quickly from the non-numeric pattern to the corresponding table of values. Starting with the previous non-numeric pattern, for example, they can immediately establish the following table.
| Term Number | 1 | 2 | 3 |
|---|---|---|---|
| Number of Circles | 5 | 7 | 9 |
Students then proceed by trial and error to determine the rule that defines the relationship, as evidenced by the student's explanations below. In each case, the depth of these students' understanding of the relationship it represents should be questioned.
Teachers need to consider the different ways that students perceive the relationships between terms in a pattern and adapt their questioning accordingly to help each student accurately express the rule in words. The following situation highlights examples of adaptive questioning:
Example 2
Present the following situation:
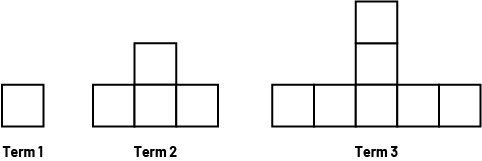
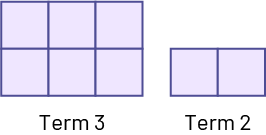
Using the following questions, encourage students to analyze the pattern and relate the term number with the number of squares it has:
- How many squares does term 1, 2, and 3 have?
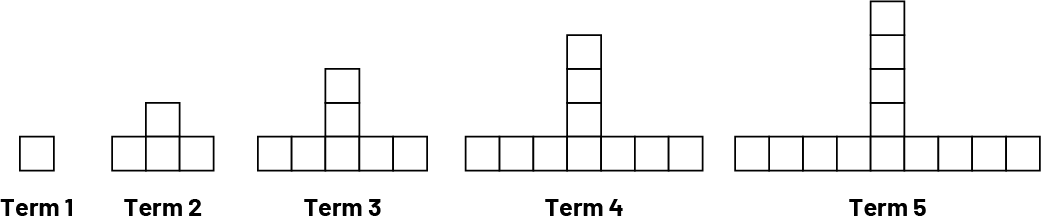
- How many squares are needed to construct term 4 ? Construct this term.
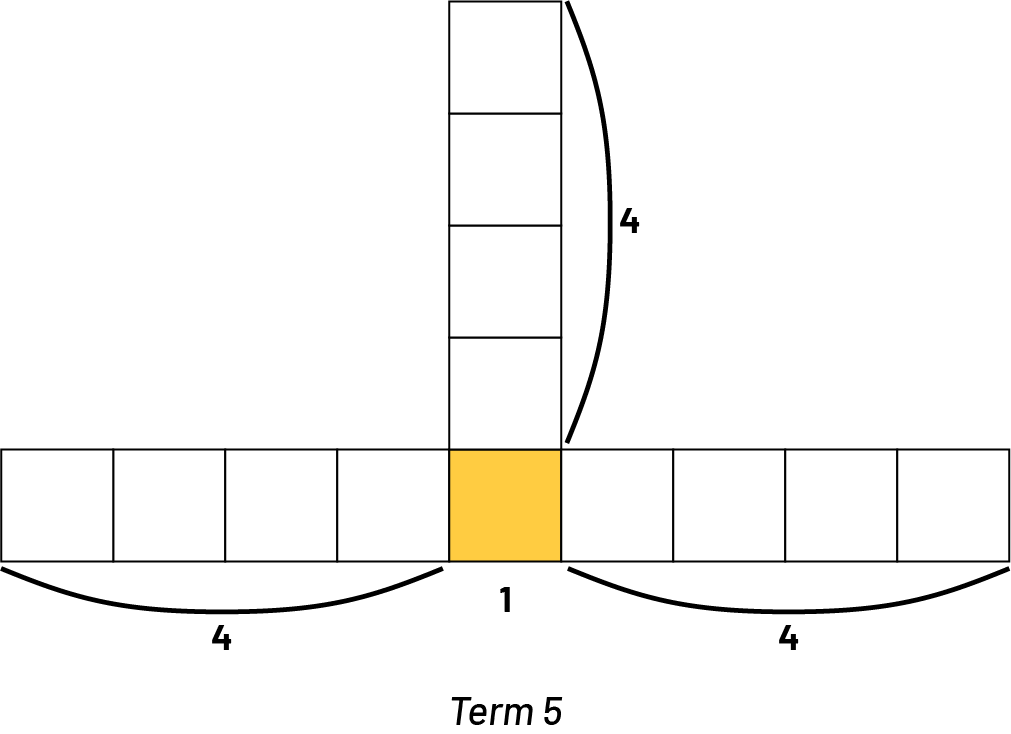
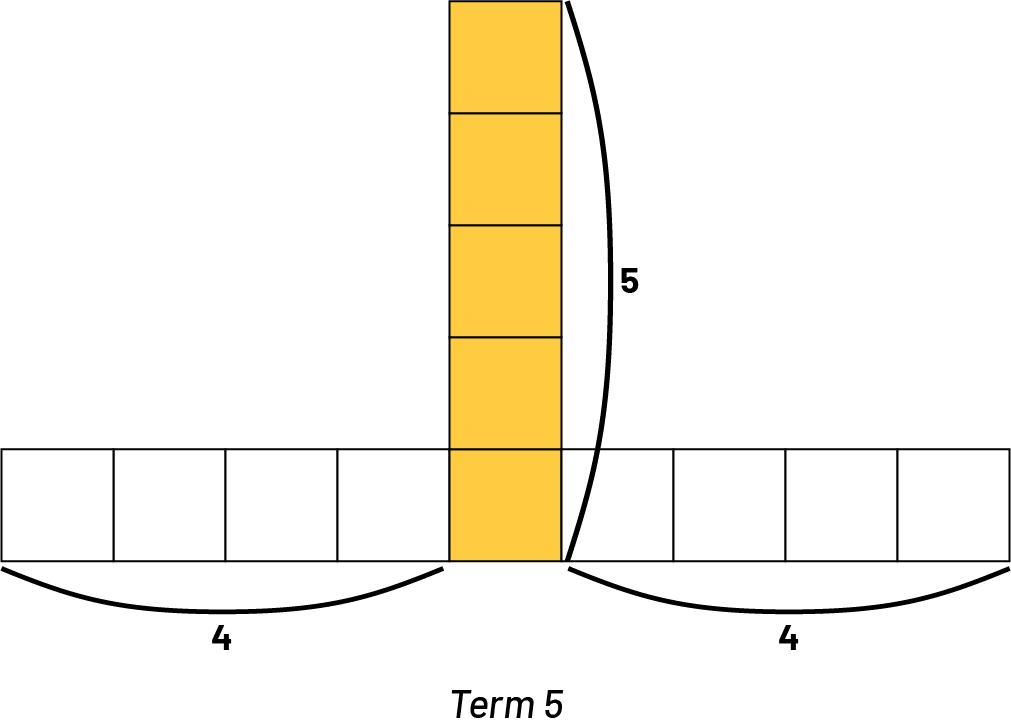
- How many squares are needed to construct term 5 ? Construct this term.
- What pattern rule can be used to determine the number of squares?
- Represent the relationship between the term number and the number of squares in each term using a table of values. What patterns do you notice in the table?
- How many squares will term 6 have? term 10 ? How do you know?
- What is another way this can be determined?
Then facilitate a mathematical discussion that focuses on students' different perceptions of the relationship. Ask them questions, such as the ones below, to get them to explain and verbalize their strategy and rule.
- What strategy did you use to count the number of squares in the 4th term?
Student 1: "For term 4, I see that there are three squares on the left, three squares on the right, three squares at the top and one square in the middle, at the bottom. That's 3 + 3 + 3 + 1, or 10 squares."
- Who used the same strategy? Did anyone use a different strategy?
Student 2: "I used a similar strategy. I see 1 square in the centre, and 3 branches of 3 squares. In total, that's 10 squares."
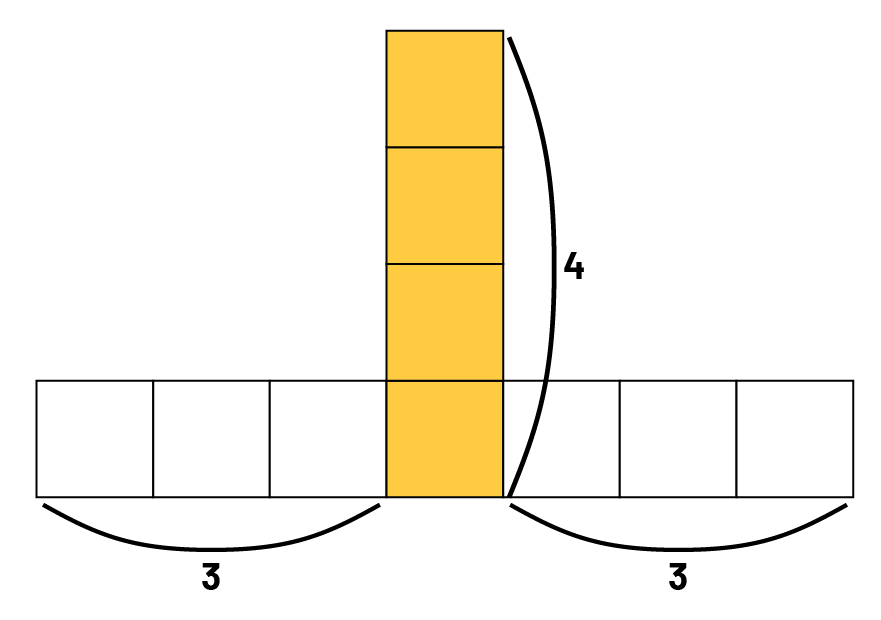
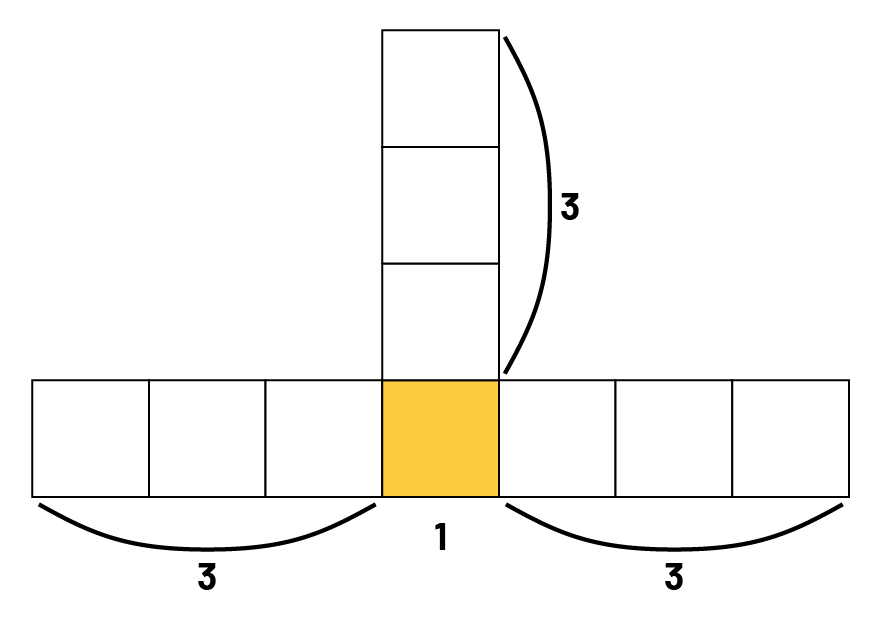
Student 3: "My strategy is different, but I got the same answer. I see a column of 4 squares, then 3 squares on the left and 3 squares on the right. In total, I counted 4 + 3 + 3, which is 10 squares."
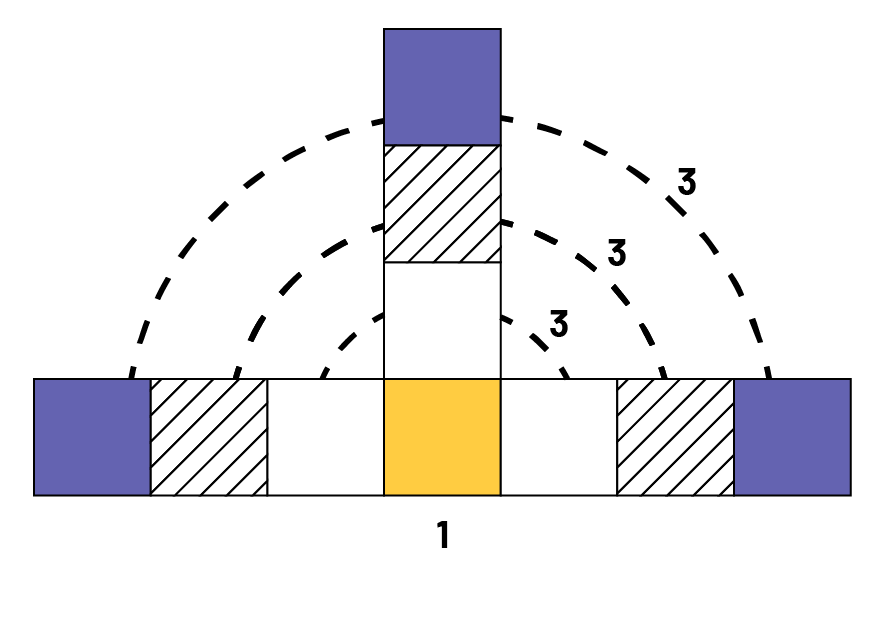
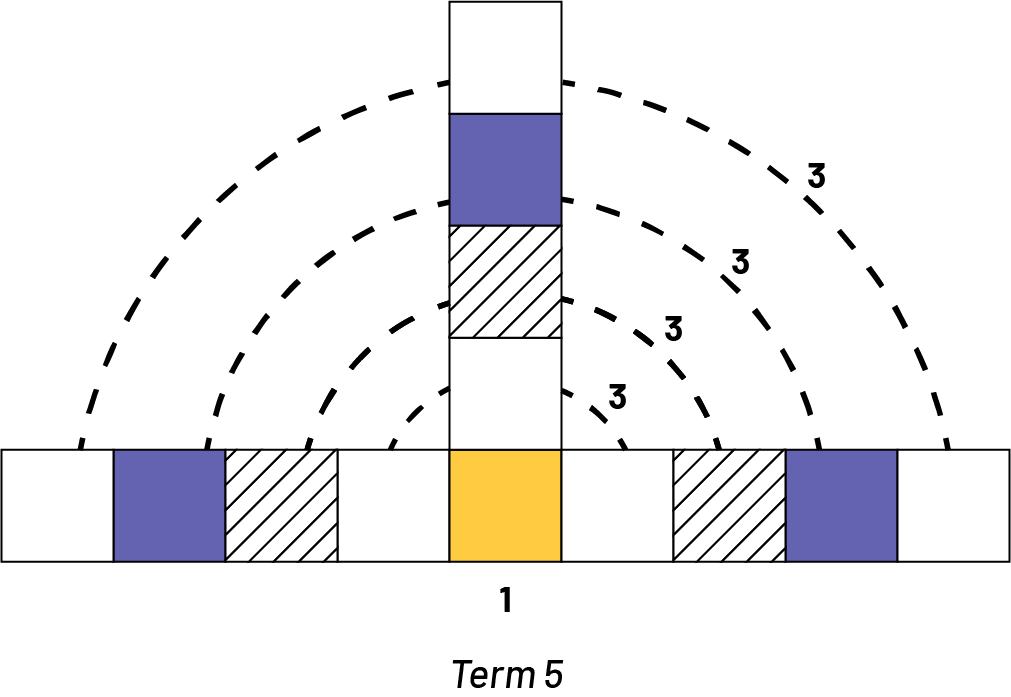
Student 4: "I see the squares in a different way. If I look at the pattern, it starts with a square and in each term, a square is added in three places. In the fourth term, the three squares have been added three times. In all, we have 10 squares."
- Does your strategy work for counting the number of squares in term 5?
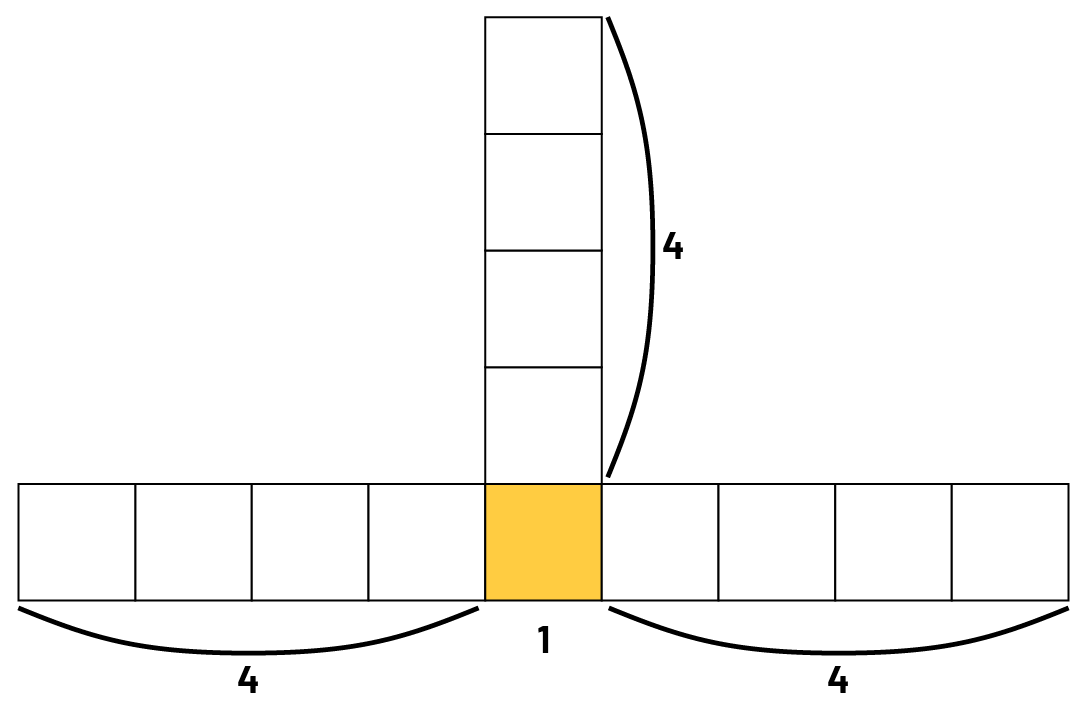
Student 1: "Yes. I see that there are four squares on the left, four squares on the right, four squares at the top, and one square in the middle, at the bottom. That's 4 + 4 + 4 + 1, or 13 squares."
Student 2: "Yes. I see a square in the middle at the bottom and three branches of four squares. That's a total of 13 squares."
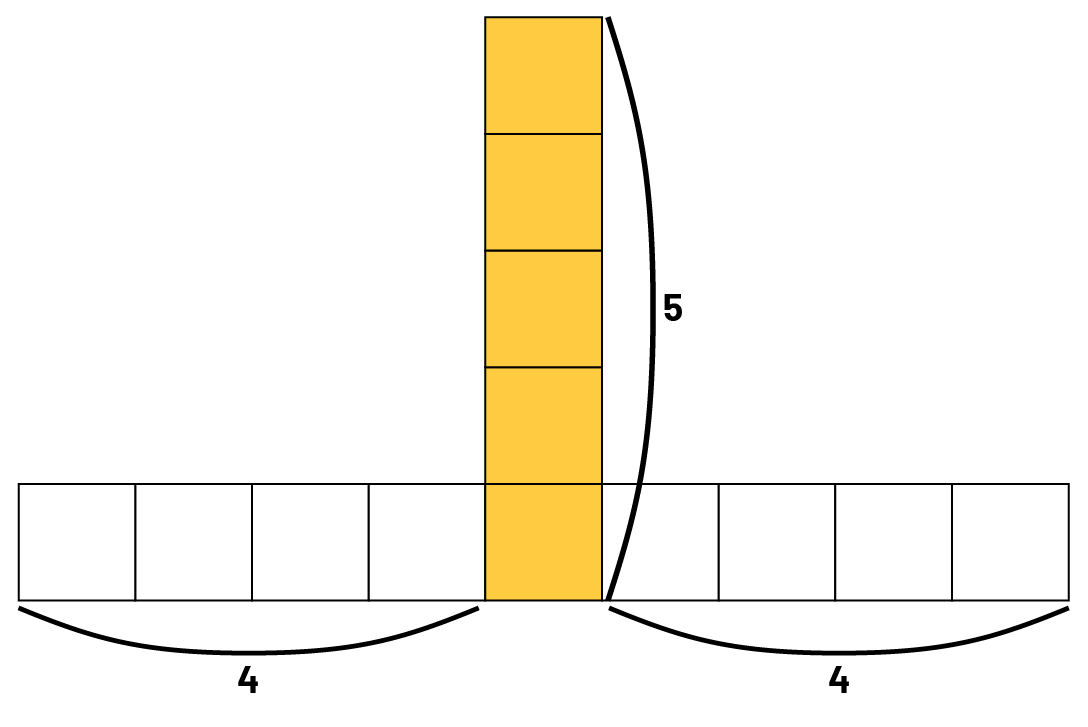
Student 3: "Yes. I see a column of five squares, then four squares on the left and four squares on the right. In total, I count 5 + 4 + 4, which is 13 squares."
Student 4: "Yes. If I look at the pattern, it starts with a square, and in each term a square is added in three places. In term 5, we add the three squares four times. In all, we have 13 squares."
- According to your strategy, how many squares will there be in term 10?
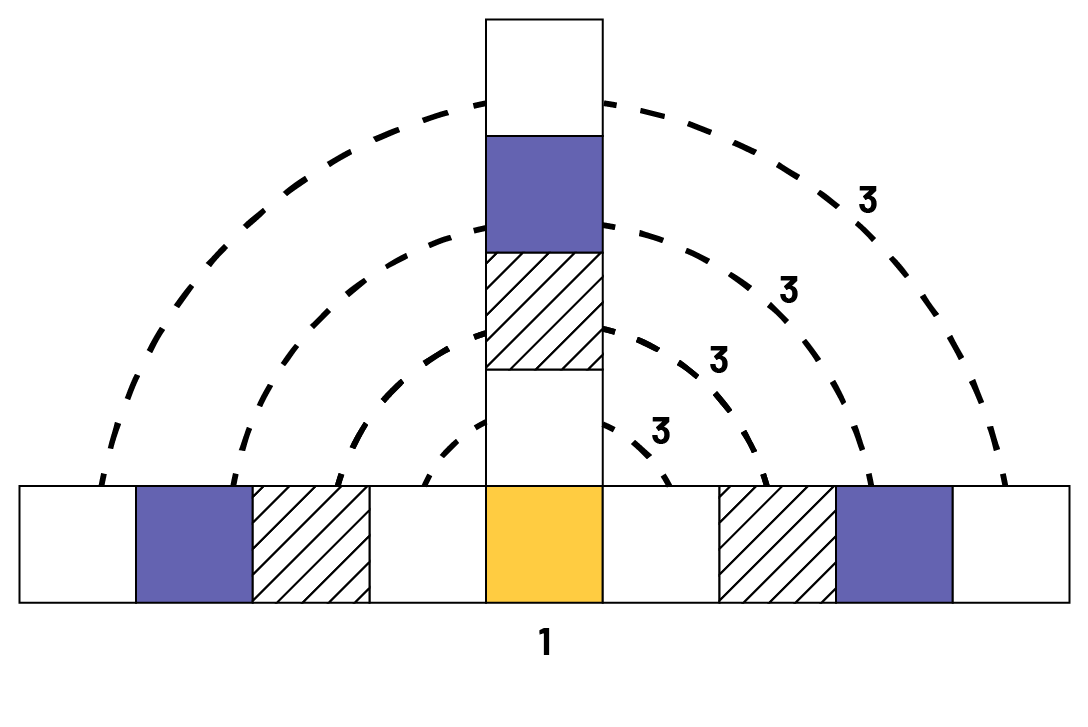
Student 1: "In the 10th term, there will be 28 squares. There will be one square in the middle, at the bottom, nine squares on the left, nine squares on the right, and nine squares at the top. In total, there will be 9 + 9 + 9 + 1, which is 28 squares."
- How do you know how many will be on the left, right and top?
Student 1: "Looking from one term to the next, there is always one square less than the term number in each of these three places."
Student 2: "My strategy is pretty well the same thing."
- How might your strategy differ?
Student 2: "He (student 1) says that he adds 9 + 9 + 9. I say that I multiply, that is to say that I do 3 × 9, because multiplying is like adding the same quantity several times."
Student 3: "I also got 28. There will be a column of 10 squares in the middle, with nine squares on the left and nine squares on the right, so 10 + 9 + 9 = 28 squares."
- How do you know it's 10 squares, then nine squares twice?
Student 3: "From the first terms in the pattern, the number of squares in the middle column is equal to the term number and the number of squares on the left and right is always 1 less than that term number."
Student 4: "The way I see the number of squares in each term, is that there is one square in the middle at the bottom. In the first term, we add three squares – one to the left, one to the right and one on top. One square is continued to be added to the left, right and top in terms 2 through 10, so nine times. In all, we will have 1 + (9 × 3), or 28 squares."
Note: Even though the calculations performed are similar, the students saw an arrangement of the squares in different ways and as a result they generated different, but equivalent, pattern rules.
- Can your strategy be used to determine the number of squares that will be in the 25th term?
Have students explain in words how to determine the value of a distant term (for example, term 10 or 25) in relation to the term number.
Some students may have difficulty in identifying the quantities involved. It is important to ask them questions such as the ones presented below to get them to express their pattern rule more clearly.
- How can you determine the number of squares for any term number?
Student 1: "To determine the number of squares for any term, I add a number three times, then add one."
- What is this number? How can you identify or name it?
Student 1: "It is always the previous term number."
- How can you express your pattern rule for determining the number of squares for any term more accurately?
Student 1: "To determine the number of squares for any term number, I add the term number of the previous term 3 times, then add 1."
Student 2: "To determine the value of any term, I multiply by three and add one."
- What do you multiply by three?
Student 2: "I multipled the previous term number by 3."
Student 3: "Each term has three branches. One branch has the same number of squares as the term number and the two others branches have one less square than the term number. To determine the total number of squares, I add these three numbers together."
- Can you explain your pattern rule in another way?
Student 3: "To determine the number of squares that make up a term given any term number, I add 2 values, the term number of the term and two times the previous term."
Student 4: "I multiply the previous term number by three and add one."
Teachers then prompt students to check the validity of their pattern rule. To validate the rules, a table of values is used.
In the previous example students extended the pattern, analyzed the pattern to describe a rule, and created a table of values showing the term values for each term number, and were asked to make connections between each of the representations.
Example 3
For this pattern, let's study the relationship between each term number and their number of squares in each term.
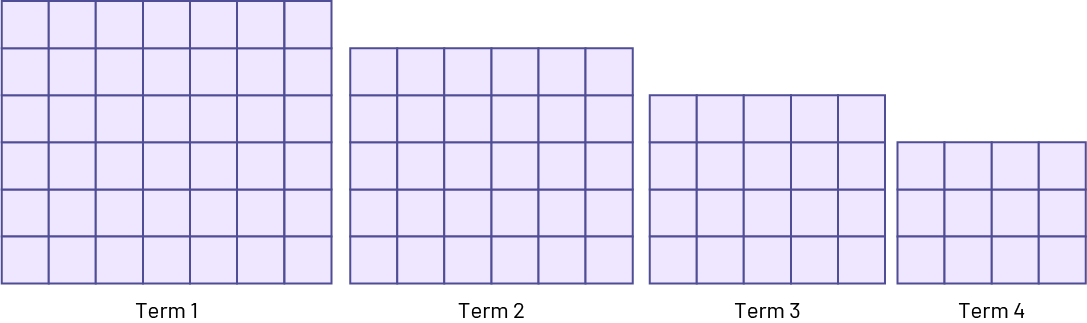
At first glance, this pattern may seem very complex, because the number of squares (2, 6, 12, 20, …) that make up each term does not have a simple pattern rule. Before putting such a pattern aside, it is important to examine it more closely. Let's continue to explore this pattern by extending and analyzing the pattern rule and constructing a table of values, and then describing in words the relationship.
Extending a Geometric Pattern
Analyzing the Pattern
Looking from one term to the next there is a pattern of removing a column and a row each time.
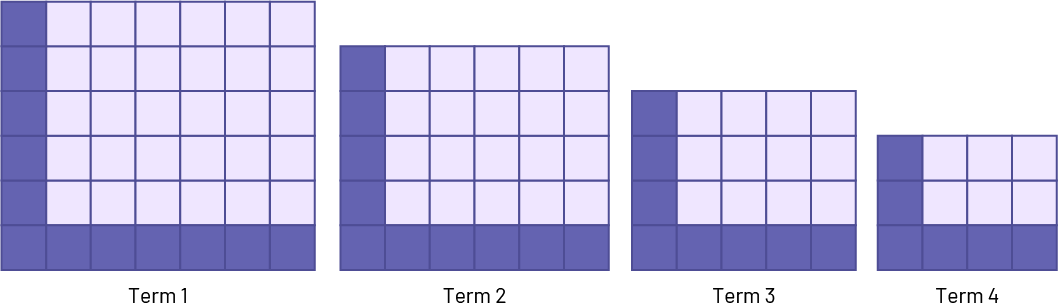
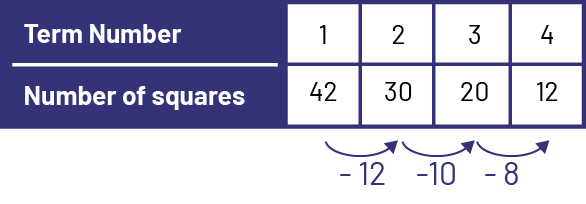
The number of squares decreases by 12, then by 10, then by 8, and so on.
To move from the 1st term to the 2nd term, 12 squares are subtracted - which can be viewed as 1 row of 6 squares and 1 column of 6 squares.
To move from the 2nd term to the 3rd term, 10 squares are subtracted - which can be viewed as 1 row of 5 squares and 1 column of 5 squares.
To move from the 3rd term to 4th term, 8 squares are subtracted - which can be viewed as 1 row of 4 squares and 1 column of 4 squares.
Table of Values
The table of values is a numeric representation of this pattern.
Extending a Shrinking Pattern
Students can explain their observations as follows:
- Term 1 is composed of 7 columns of 6 squares.
- Term 2 is composed of 6 columns of 5 squares.
- Term 3 is composed of 5 columns of 4 squares.
One way to extend the pattern is to use the pattern rule. For this pattern the number of squares decreases by 2 more each time. So to figure out the number of squares in term 5 we will need to decrase by 6 for a result of 6.
Source: translated from Guide d'enseignement efficace des mathématiques, de la 4e à la 6e année, Modélisation et algèbre, p. 54-65.
Knowledge: Pattern Rules
Recursive Pattern Rule: a rule that describes a pattern by what changes from one term to the next.
Functional Pattern Rule: a rule that describes the relationship between any term number and its term value.
Source: Ontario Curriculum, Mathematics Curriculum, Grades 1-8, 2020, Ontario Ministry of Education.
Repeating Pattern

Pattern rule: pattern core is repeat the blue rectangle, green trapezoid, orange triangle.
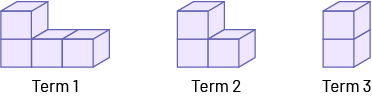
Growing Geometric Pattern
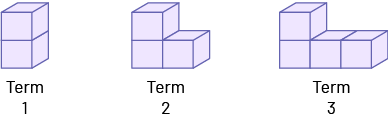
Functional Pattern rule:
- Each term is composed of a column of 2 cubes, and a row consisting of 1 less cube than the term number.
Shrinking Geometric Pattern
Recursive Pattern Rule:
- Each term is composed of a column of 2 cubes and a row consisting of one cube less than the term before.
Growing Numeric Pattern
4, 8, 16, 32, 64
Recursive Pattern Rule:
- The value of the term is double the previous term.