C1.2 Create and translate growing and shrinking patterns using various representations, including tables of values and graphs.
Activity 1: My Friends' Friends (Pattern Representations)
Present the following situation to the students:
Kim called her friends to take part in a school activity. On Monday, she called four of them. On Tuesday, each of the four people called four more friends. On Wednesday, each person who received a call on Tuesday called four more people.
Allow students to represent the situation using the strategy of their choice.
Example
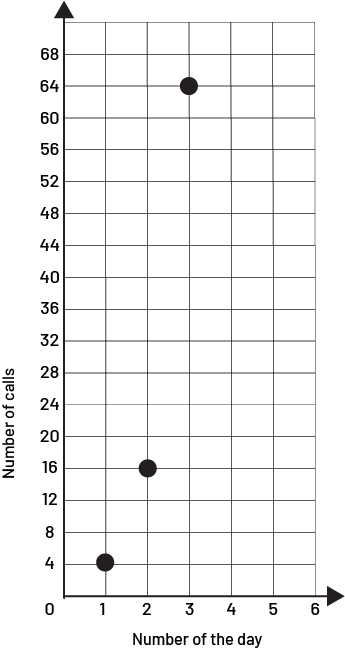
Represent the situation using a table of values
| Day | Number of calls |
|---|---|
| 1 | 4 |
| 2 | 16 |
| 3 | 64 |
Represent the situation using a graph
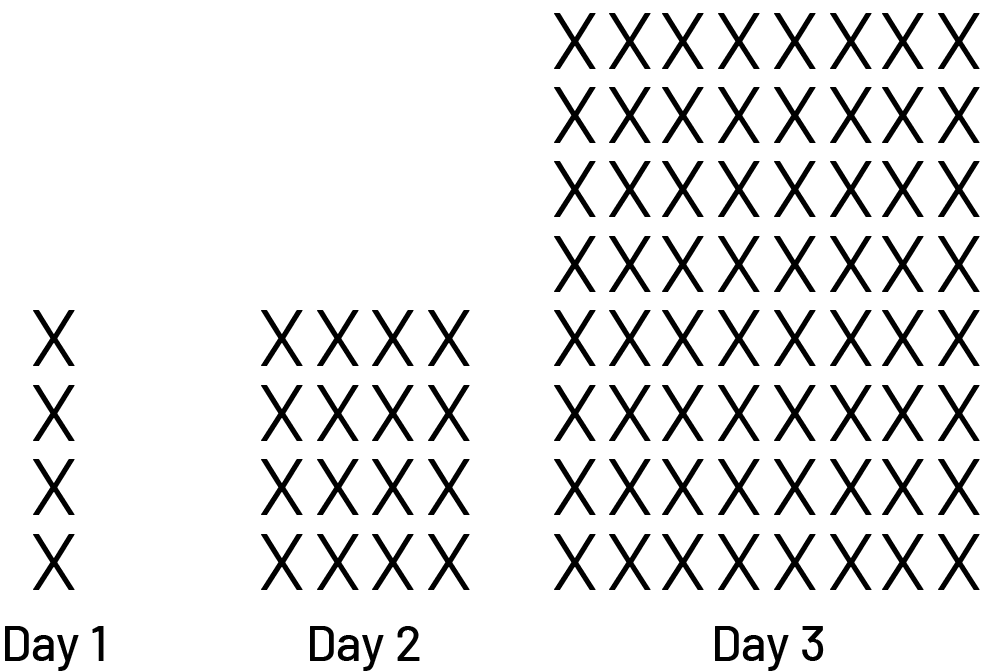
Represent the situation using a picture
Source: adapted from En avant, les maths, 5e année, ML, Algèbre, Reconnaître, décrire, représenter et créer des suites numériques croissantes et décroissantes comprenant des nombres naturels, p. 20.
Activity 2: What Takes Longer: Getting Out of a Room or Getting In?
This activity involves concepts from the Algebra and Data strands and highlights the table of values and graphs to situations.
Present the following situation:
The school council wanted to know if students take longer to enter the gym than to exit. So one day, as the students prepared to leave for a field trip, the student council collected data as students entered and exited the gym.
Distribute a copy of the Entry and Exit Appendix to the students and ask them to complete the two representations. Have students examine each of the representations and share their observations.
Here are some possible observations:
- On entry, the number of students in the gym increases, while on exit, it decreases.
- Twenty-five students per minute enter the gym.
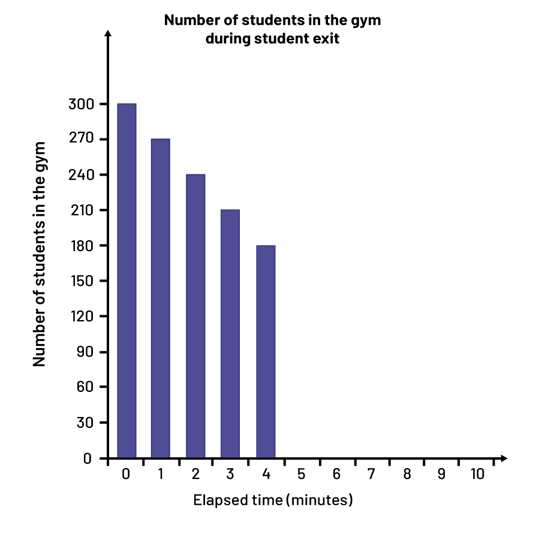
- The number of students in the gym prior to the start of the field trip is 300.
- Thirty students a minute walk out of the gym.
- The time required to get all the students out of the gym is shorter than the time required to get them in.
Have students represent the given table of values in Appendix A as a graph, and to represent the given graph in Appendix B as a table of values.
Note: By exploring both representations of the same situation simultaneously, students can more easily see the connection between the data in the table of values and the data in the graph. Graphical representations help visualize a set of numerical data; therefore, they help to see if it is a growing or shrinking situation and if there is a pattern.
Here are some suggested questions to highlight relationships:
- How does a graph help you to see if there is a growing or shrinking pattern?
- If more students entered the gym after 15 minutes, can you use the graph to determine how many students would be in the gym? (Based on the increase, we see that after 15 minutes there would be 375 students in the gym.)
- Can you explain, in your own words, a pattern rule to represent the relationship between the number of students in the gym and the amount of time that has passed since they entered the gym? (To determine the number of students in the gym at a certain time, multiply the elapsed time by 25.)
- Can the same pattern rule be used to represent the relationship between the number of students in the gym and the amount of time since the students began to leave? Explain your reasoning. (No, because the time required to enter the gym is not the same as the time required to exit.)
- What pattern rule can represent the relationship between the number of students in the gym and the time elapsed since the start of the field trip? (To determine the number of students in the gym after a certain number of minutes from the start of the field trip, multiply the elapsed time by 30, and then subtract this product from the number of students in the gym at the start, which is 300.)
Source: translated from Guide d'enseignement efficace des mathématiques, de la 4e à la 6e année, Modélisation et algèbre, p. 107-108.
Appendix: Gymnasium Student Entry
| Elapsed time (minutes) | 0 | 1 | 2 | 3 | 4 | 5 | 6 | 7 | 8 | 9 | 10 | 11 | 12 |
|---|---|---|---|---|---|---|---|---|---|---|---|---|---|
| Number of students in the gym | 0 | 25 | 50 | 75 |
Appendix: Gymnasium Student Exit
Source: translated from Guide d'enseignement efficace des mathématiques, de la 4e à la 6e année, Modélisation et algèbre, p. 116.
Activity 3: Long Live Recycled Paper!
Lead a class discussion on the environmental impacts from paper production and forestry. This will be an opportunity to discuss the relationship between making recycled paper and limiting the amount of trees needed for paper production. Present the following information:
On average, the production of 10 000 sheets of recycled paper saves approximately one tree. For this reason, a school has chosen to use only recycled paper and they have kept a cumulative count of the number of sheets of paper used at the end of each three months.
After the first month, 10 000 sheets were used. After the second month, 15 000 sheets were used, and after the third month, 20 000 sheets.
The following questions can be used to draw out some different relationships that the situation presents:
- How many sheets will have been used after the fourth month, fifth month and tenth month if consumption remains constant (for example, if pattern is maintained)?
Students can represent the relationship between the number of months and the number of sheets used using a table of values.
| Number of months (n) | 1 | 2 | 3 | 4 | 5 | 6 | 7 | 8 | 9 | 10 |
|---|---|---|---|---|---|---|---|---|---|---|
| Total number of sheets used (f) | 10 000 | 15 000 | 20 000 | 25 000 | 30 000 | 35 000 | 40 000 | 45 000 | 50 000 | 55 000 |
Continue the discussion with the following questions:
- How many trees were saved after one month by using recycled paper instead of non-recycled paper? (One tree was saved.)
- How many trees were saved after one school year (10 months) if recycled paper was used? (Five and a half trees were saved.)
- What pattern rule can be used to describe the relationship between the number of trees saved and the number of sheets used? (The number of trees saved is the number of leaves used divided by 10 000.) The table of values below also represents this relationship.
| Total number of sheets used (f) | 10 000 | 15 000 | 20 000 | 25 000 | 30 000 | 35 000 | 40 000 | 45 000 | 50 000 | 55 000 |
|---|---|---|---|---|---|---|---|---|---|---|
| Number of trees saved(a) | 1 | 1.5 | 2 | 2.5 | 3 | 3.5 | 4 | 4.5 | 5 | 5.5 |
Note: Students may think that the number of trees saved is small (in one year, this school would have saved less than six trees). However, by putting the action in a global context (for example, if each school uses only 100% recycled paper), students will better understand the benefit of this responsible practice.
To get students to grasp what such quantities of sheets represent, teachers show them a box of paper and present the relationship between the number of bundles in the box and the number of sheets in the box (10 bundles of 500 sheets, or 5 000 sheets). The teacher asks questions to prompt them to create a table of values that represents the relationship between any number of packets of sheets and the corresponding total number of sheets, and another that represents the relationship between any number of packets of sheets and the corresponding number of boxes.
Here are some suggested questions to ask:
- How many packages are equivalent to 2000 sheets of paper? 3 000 sheets? 10 000 sheets?
- How can we mathematically determine how many bundles are equivalent to a given number of sheets?
- How many packages of sheets will there be in two boxes? three boxes? 10 boxes?
- How can we mathematically determine the number of packages in a given number of boxes?
- How many boxes of recycled paper did the school in this question use? (The school used 11 boxes of recycled paper.)
Source: translated from Guide d'enseignement efficace des mathématiques, de la 4e à la 6e année, Modélisation et algèbre, p. 110-112.