C1.3 Determine pattern rules and use them to extend patterns, make and justify predictions, and identify missing elements in repeating, growing, and shrinking patterns, and use algebraic representations of the pattern rules to solve for unknown values in linear growing patterns.
Skill: Determining and Using Rules to Extend Patterns, Making and Justifying Predictions, and Finding Missing Elements
Describing pattern rules in everyday language is an important step in the development of algebraic thinking.
Patterns can be described using functional thinking and recursive thinking. Describing the relationship between the term number and the term value is functional thinking. For example, each term has a value that is twice its term number. Recursive thinking can be used to make near predictions. Functional thinking tends to be used to make far predictions, such as what is the 25th term?
Students learn to use an equation to represent a functional relationship expressed in words. They must choose the variables and formulate an equation that represents the pattern rule, which helps develop a sense of symbols. It is in this context that the resulting equations and the relationships they represent become meaningful.
Source: translated from Guide d’enseignement efficace des mathématiques de la 4e à la 6e année, Modélisation et algèbre, p. 52.
Some pattern rules can be used to reinforce students' sense of number while developing their algebraic thinking. Contextual situations are best used because they are less abstract. Situations can feature a variety of pattern rules.
Here are some examples:
Example 1
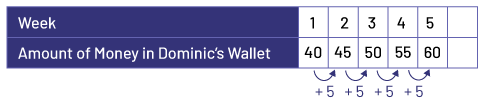
Dominic is saving up to buy a video game that costs $74.25 (including taxes). However, he only has $35 in his wallet. Every week, his parents give him $5, which he keeps in his wallet. The relationship between the number of weeks that pass and the number of dollars in Dominic's wallet can be represented by a table of values.
| Week | 1 | 2 | 3 | |||
|---|---|---|---|---|---|---|
| Amount of Money in Dominic's Wallet | 40 | 45 | 50 |
a) How much money will Dominic have in his wallet after 5 weeks if he doesn't spend any?
Recursive Pattern Rule Involving Addition
The relationship between the number of dollars in Dominic's wallet from week to week can be represented by a table of values. Each term increases by a value of 5.
I extended the value table and determined that he will have $60 after 5 weeks.
Functional Relationship
The relationship between the number of weeks passed and the amount of money in the wallet can be represented using words.
- On week 1, Dominique has $35 and 1 $5 bill in his wallet, which gives him $40.
- On week 2, Dominique has $35 and 2 $5 bills in his wallet, which gives him $45.
- On week 3, Dominique has $35 and 3 $5 bills in his wallet, which gives him $50.
- On week 4, Dominic has $35 and 4 $5 bills in his wallet, giving him $55.
- On week 5, Dominic has $35 and 5 $5 bills in his wallet, giving him $60.
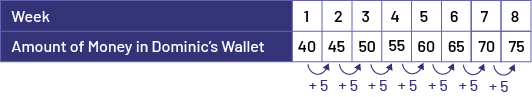
b) After how many weeks will Dominic have enough money to buy the video game?
I extended the table of values until there is $75 in the wallet and determined that it will be after 8 weeks.
Functional Relationship
The number of $5 bills is always the same as the number of weeks that have passed, plus the $35 that was already in his wallet (the constant).
So, on week 8, Dominique has $35 and 8 $5 bills in his wallet, which gives him $75.
35 $ + (8 × 5 $) = 35 $ + 40 $ = 75 $
Note: In the past, such a situation would have been presented as part of problem-solving activities and only the second question would have been asked. The problem solving would have involved an arithmetic method, for example:
Dominic earns $5 a week. He is short $39.25. Since 39.25 ÷ 5 = 7.85, or about 8, it will take him 8 weeks.
However, the approach used here is more algebraic, since it relies on the comparison of two changing quantities.
Example 2
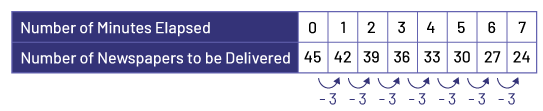
A student has to deliver 45 newspapers in their neighborhood. The following table of values represents the relationship between the number of minutes elapsed since the start of the delivery and the number of newspapers that are left to deliver.
| Number of Minutes Elapsed | 0 | 1 | 2 | 3 | 4 |
|---|---|---|---|---|---|
| Number of Newspapers to be Delivered | 45 | 42 | 39 | 36 | 33 |
a) How many newspapers are left to deliver after 7 minutes? Explain your answer.
Recursive Pattern Rule Involving Subtraction
I found there are 3 less newspapers to deliver every minute. This means that the student delivers 3 newspapers every minute. I extended the table of values using this pattern rule, which allowed me to conclude that after 7 minutes, 24 newspapers are left to be delivered.
b) How long does the delivery man take to deliver all his newspapers?
I extended the table of values until there were 0 newspapers left and found that it took 15 minutes to deliver all of the newspapers.
| Number of Minutes Elapsed | 0 | 1 | 2 | 3 | 4 | 5 | 6 | 7 | 8 | 9 | 10 | 11 | 12 | 13 | 14 | 15 |
|---|---|---|---|---|---|---|---|---|---|---|---|---|---|---|---|---|
| Number of Newspapers to be Delivered | 45 | 42 | 39 | 36 | 33 | 30 | 27 | 24 | 21 | 18 | 15 | 12 | 9 | 6 | 3 | 0 |
Functional Relationship
The number of newspapers delivered is equal to the initial number of newspapers (45) minus three times the number of minutes elapsed. The equation is therefore n = 45 - 3m, where n is the number of newspapers to be delivered and m, the number of minutes elapsed.
Example 3
Emily babysits regularly. A couple asks her to look after their child for 6 hours a day for 10 days and offers to pay her according to the following table of values:
| Term Number (Day) | 1 | 2 | 3 | 4 | … |
|---|---|---|---|---|---|
| Salary for the Day ($) | 1 | 2 | 4 | 8 | … |
If she accepts the offer, how much money will Emily earn in total?
Recursive Pattern Rule Involving Multiplication
I noticed that the salary doubles every day. I extended the table of values to 10 days. I then added up the amounts and found that Emily would earn a total of $1,023 for 10 days of babysitting.

Example 4
In this soccer tournament, there are 64 teams present. On the first day, all the teams play a game and if any team loses they are eliminated. On the second day, the remaining 32 teams play a game and again the losing teams are eliminated. The same process is followed on each subsequent day.
a) Construct a table of values that represents the relationship between the term (day) and the number of teams playing a game on that day.
Recursive Pattern Rule Involving Division
I noticed that the number of teams playing a game decreases by half each day. The pattern rule is therefore ÷ 2.
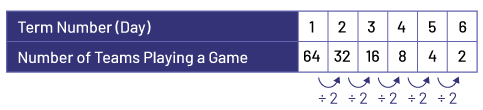
b) On what day will the last game take place?
The last game will be played on the 6th day.
Source: translated from Guide d’enseignement efficace des mathématiques de la 4e à la 6e année, Modélisation et algèbre, p. 35-37.
It is important to recognize that the path to the expression of a matching rule may differ from person to person, since reasoning develops from individual perceptions. The example below, inspired by research conducted by Radford ("Algebraic thinking and the generalization of patterns: a semiotic perspective", in J. L. C. S. Alatorre, M. Sáiz, A. Méndez (Eds.), Proceedings of the 28th Conference of the International Group for the Psychology of Mathematics Education, North American Chapter, vol. 1, Mérida, Mexico, 2006, pp. 2-21, as cited in Ontario Ministry of Education, A Guide to Effective Instruction in Mathematics, Grades 4-6: Modeling and Algebra, 2008, p. 54), illustrates how students may perceive the relationship between the term number and the term value.
The example below illustrates how differently students can perceive the relationship between the term number in a non-numeric growing pattern and the number of squares that make it up. The situation illustrates examples of appropriate questions.
Example
Present the following situation:
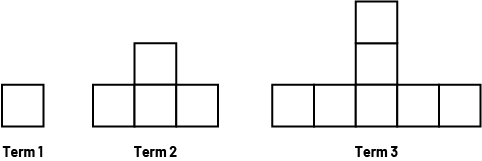
Using the following questions, encourage students to analyze the pattern and relate the term number with the number of squares it has:
- How many squares does term 1, 2, and 3 have?
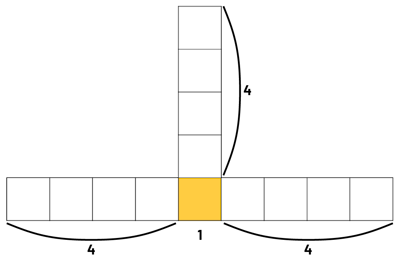
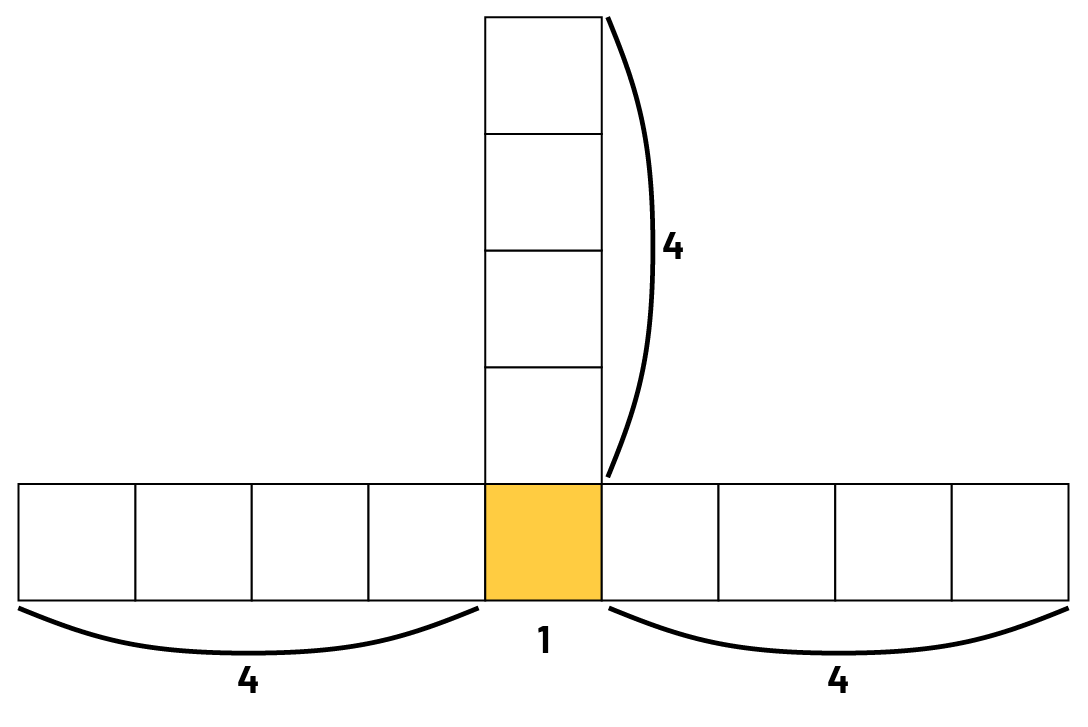
- How many squares are needed to construct term 4 ? Construct this term.
- How many squares are needed to construct term 5 ? Construct this term.
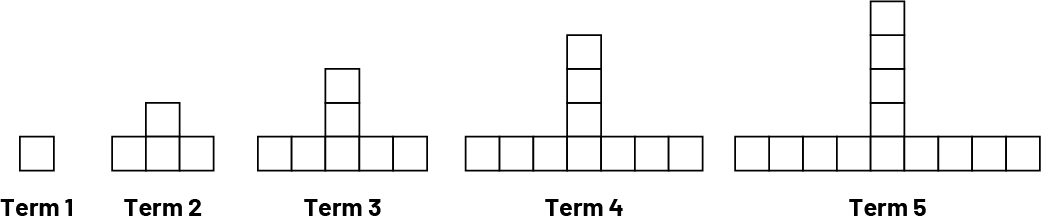
- What pattern rule can be used to determine the number of squares?
- Represent the relationship between the term number and the number of squares in each term using a table of values. What patterns do you notice in the table?
- How many squares will term 6 have? term 10 ? How do you know?
- What is another way this can be determined?
Then facilitate a mathematical discussion that focuses on students' different perceptions of the relationship. Ask them questions, such as the ones below, to get them to explain and verbalize their strategy and rule.
- What strategy did you use to count the number of squares in the 4th term?
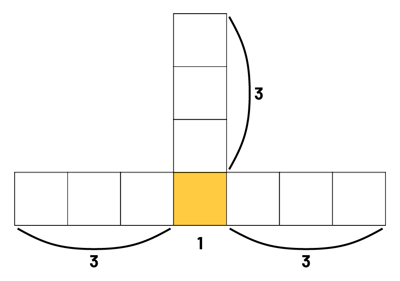
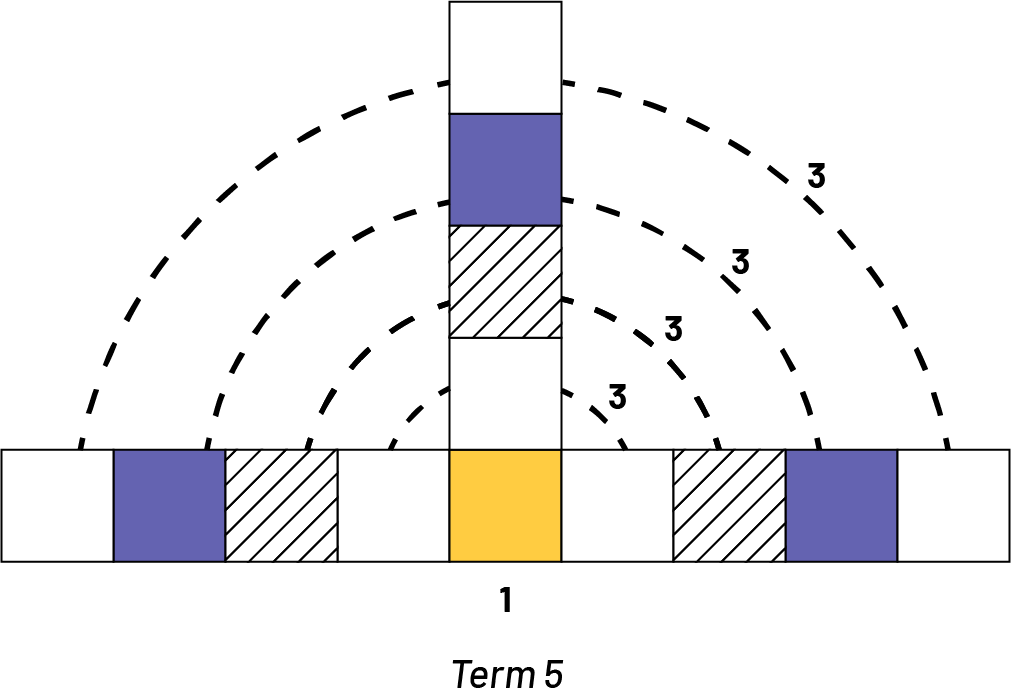
Student 1: "For term 4, I see that there are three squares on the left, three squares on the right, three squares at the top and one square in the middle, at the bottom. That's 3 + 3 + 3 + 1, or 10 squares."
- Who used the same strategy? Did anyone use a different strategy?
Student 2: "I used a similar strategy. I see 1 square in the centre, and 3 branches of 3 squares. In total, that's 10 squares."
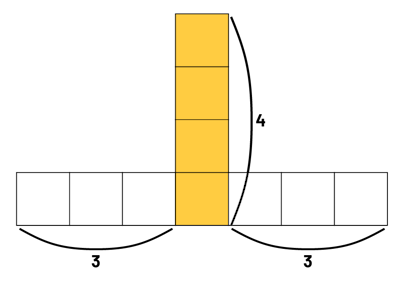
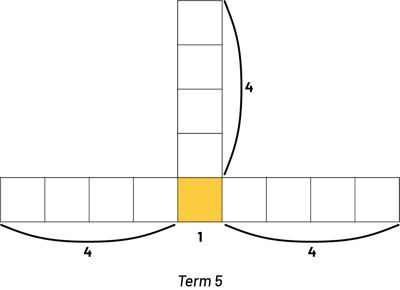
Student 3: "My strategy is different, but I got the same answer. I see a column of 4 squares, then 3 squares on the left and 3 squares on the right. In total, I counted 4 + 3 + 3, which is 10 squares."
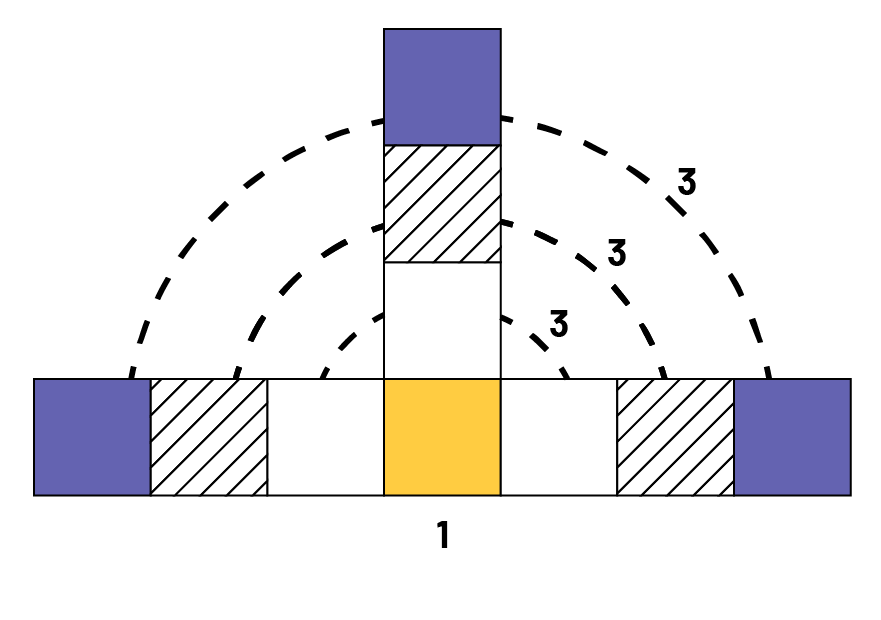
Student 4: "I see the squares in a different way. If I look at the pattern, it starts with a square and in each term, a square is added in three places. In the fourth term, the three squares have been added three times. In all, we have 10 squares."
- Does your strategy work for counting the number of squares in term 5?
Student 1: "Yes. I see that there are four squares on the left, four squares on the right, four squares at the top, and one square in the middle, at the bottom. That's 4 + 4 + 4 + 1, or 13 squares."
Student 2: "Yes. I see a square in the middle at the bottom and three branches of four squares. That's a total of 13 squares."
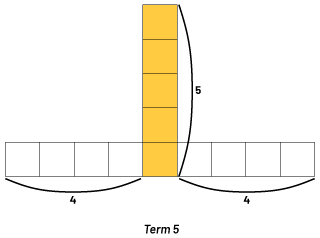
Student 3: "Yes. I see a column of five squares, then four squares on the left and four squares on the right. In total, I count 5 + 4 + 4, which is 13 squares."
Student 4: "Yes. If I look at the pattern, it starts with a square, and in each term a square is added in three places. In term 5, we add the three squares four times. In all, we have 13 squares."
- According to your strategy, how many squares will there be in term 10?
Student 1: "In the 10th term, there will be 28 squares. There will be one square in the middle, at the bottom, nine squares on the left, nine squares on the right, and nine squares at the top. In total, there will be 9 + 9 + 9 + 1, which is 28 squares."
- How might your strategy differ?
Student 1: "Looking from one term to the next, there is always one square less than the term number in each of these three places."
Student 2: "My strategy is pretty well the same thing."
- Why do you say this is the same as the other strategy (student 1)?
Student 2: "He (student 1) says that he adds 9 + 9 + 9. I say that I multiply, that is to say that I do 3 × 9, because multiplying is like adding the same quantity several times."
Student 3: "I also got 28. There will be a column of 10 squares in the middle, with nine squares on the left and nine squares on the right, so 10 + 9 + 9 = 28 squares."
- How do you know it's 10 squares, then nine squares twice?
Student 3: "From the first terms in the pattern, the number of squares in the middle column is equal to the term number and the number of squares on the left and right is always 1 less than that term number."
Student 4: "The way I see the number of squares in each term, is that there is one square in the middle at the bottom. In the first term, we add three squares – one to the left, one to the right and one on top. One square is continued to be added to the left, right and top in terms 2 through 10, so nine times. In all, we will have 1 + (9 × 3), or 28 squares."
Note: Even though the calculations performed are similar, the students saw an arrangement of the squares in different ways and as a result they generated different, but equivalent, pattern rules.
- Can your strategy be used to determine the number of squares that will be in the 25th term?
Have students explain in words how to determine the value of a distant term (for example, term 10 or 25) in relation to the term number.
Some students may have difficulty in identifying the quantities involved. It is important to ask them questions such as the ones presented below to get them to express their pattern rule more clearly.
- How can you determine the number of squares for any term number?
Student 1: "To determine the number of squares for any term, I add a number three times, then add one."
- What is this number? How can you identify or name it?
Student 1: "It is always the previous term number."
- How can you express your pattern rule for determining the number of squares for any term more accurately?
Student 1: "To determine the number of squares for any term number, I add the term number of the previous term 3 times, then add 1."
Student 2: "To determine the value of any term, I multiply by three and add one."
- How can you now express this pattern rule (functional relationship) with an equation?
Student 1: "The equation would be s =(n - 1) +(n - 1) +(n - 1) + 1, where n is the term number and s is the number of squares in it."
Student 2: "To determine the value of any term, I multiply by 3 and add 1."
- What do you multiply by three?
Student 2: "I multipled the previous term number by 3."
- If we represent the term number by n, how can we represent the previous term number?
Student 2: "This is n - 1. So the equation is s = 1 + 3 ×(n - 1), where n is the term number and s is the number of squares in that term."
Student 3: "Each term has three branches. One branch has the same number of squares as the term number and the two others branches have one less square than the term number. To determine the total number of squares, I add these three numbers together."
- Can you explain your pattern rule in another way?
Student 3: "To determine the number of squares that make up any term, I add 3 values, the term number and twice the previous term number. So, s = n +(n - 1) +(n - 1), where n is the term number and s is the number of squares that make it up."
Student 4: "I do 3 times a number to determine the number of squares on the 3 branches and add 1 for the one in the centre. Basically, I multiply the previous term number by 3 and add 1. So, s =(n - 1) × 3 + 1, where n is the term number and s is the number of squares in it."
Teachers then prompt students to check the validity of their pattern rule. To validate the rules, a table of values is used.
- According to your rule, if n takes a value of 4, what is the corresponding value of s?
Student 1: "My equation becomes s = (4 - 1) + (4 - 1) + (4 - 1) + 1. Therefore, s = 10."
Student 2: "My equation becomes s = 1 + 3 × (4 - 1). Therefore, s = 10."
Student 3: "My equation becomes s = 4 + (4 - 1) + (4 - 1). Therefore, s = 10."
Student 4: "My equation becomes s = (4 - 1) × 3 + 1. Therefore, s = 10."
- What does this value of s correspond to in your equation?
Student 1: "The variable s represents the number of squares that make up the term. In the given pattern, the 4th term is composed of 10 squares."
- According to your equation, s = 10 when n = 4. What does this correspond to in the table of values?
Student 2: "According to the table of values, the 4th term is composed of 10 squares. This matches what I get from the equation."
In the previous example students extended the pattern, analyzed the pattern to describe a rule, and created a table of values showing the term values for each term number, and were asked to make connections between each of the representations.
Source: translated from Guide d'enseignement efficace des mathématiques, de la 4e à la 6e année, Modélisation et algèbre, p. 54-64.
Skill: Using Symbolic Representations of Rules to Find Unknown Values in Linear Growing Patterns
When a rule for a linear growing pattern is expressed as an equation, the variables in the equation represent the term number and the term value. When a specific term number is substituted into the equation, the equation can then be solved for the corresponding term value. When a specific term value is substituted into the equation, the equation can then be solved for the corresponding term number.
Example of a Representing the Relationship Between Two Variables and Solving for an Unknown
Write the equation s = g × 2 on the board and present its context:
Eric invites some friends to his house. When they enter, he asks them to take off their shoes and put them on a step of the stairs. We are interested in the relationship between the number of guests (g)and the number of shoes (s).
With students, create a geometric pattern, and a table of values to represent the relationship between number of guests and the number of shoes. Ask students to create a graph. The following questions can be asked to give contexts to solving for unknown values.
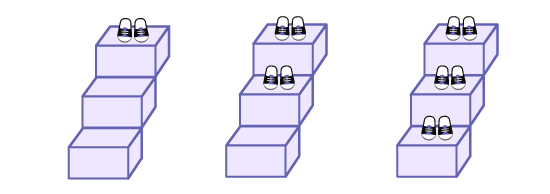
Ask students to explain what variable g (the number of guests), variable s (the number of shoes), and "× 2" (the number of shoes per person) represent.
Relevant questions
- How can you determine the total number of shoes using the table of values? the graph? the equation?
- Use the equation to determine how many shoes will be on the stairs if Eric has 6 guests? 15 guests? Verify the reasonableness of your answer using the table of values and the graph.
- Use the equation to determine how many guests will Eric have if there are 48 shoes on the steps. Verify the reasonableness of your answer using the table of values and the graph.
Source: translated from Guide d’enseignement efficace des mathématiques de la 4e à la 6e année, Modélisation et algèbre, p. 238.
Knowledge: Interpolation
Interpolation is the process of estimating values that lie within a given range.
Source: Ontario Curriculum, Mathematics Curriculum, Grades 1-8, 2020, Ontario Ministry of Education.
Example
Determine the value of the cost when the quantity is 7.
| Quantity | 2 | 4 | 6 | 8 | 10 | 12 |
|---|---|---|---|---|---|---|
| Cost ($) | 6 | 12 | 18 | 24 | 30 | 36 |
Note: In this case, the student can average the costs of quantities 6 and 8.
Knowledge: Extrapolation
Extrapolation is the process of estimating values that lie outside of a given range.
Source: Ontario Curriculum, Mathematics Curriculum, Grades 1-8, 2020, Ontario Ministry of Education.
Example
Determine the value of the cost when the quantity is 22.
| Quantity | 2 | 4 | 6 | 8 | 10 | 12 |
|---|---|---|---|---|---|---|
| Cost ($) | 6 | 12 | 18 | 24 | 30 | 36 |
Note 1: In this case, the student can first determine that the equation is c =3q, and then calculate the cost by replacing q with 22, which results in $66.
Note 2: Vary between the term number and the term value as the unknown value. This will encourage flexibility and deepen understanding.