C1.2 Create and translate repeating, growing, and shrinking patterns involving whole numbers and decimal numbers using various representations, including algebraic expressions and equations for linear growing patterns.
Activity 1: Strategies (Linear Growing Patterns)
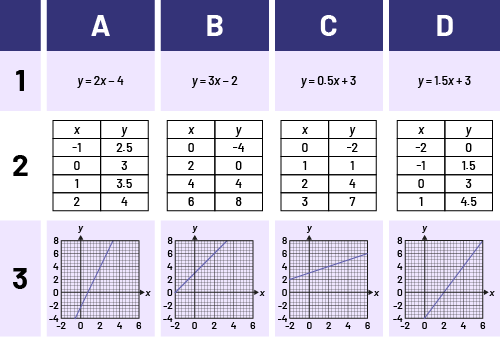
Cut out the equations, tables of values, and graphs from the table below. Divide students into teams and distribute the cut-outs to each team. Teams should combine the different linear pattern representations in such a way as to group the graph, table of values, and equation by comparing the initial values, b, and the constant rate, m (for example, 1A, 2B, and 3C could represent the same situation).
Debrief as a class, focusing on the students' grouping strategy/strategies.
Strategy 1: Solution determined by comparing the initial values in the 3 forms of representations.
I looked for the initial value in each of these equations knowing that b in the formula \(y = mx + b \) is the initial value. In the table of values, I looked for the value of y when x = 0. In the graph, I look for the value of y when the line crosses the y-axis.
First match: The line crosses the y-axis at y = -4.
Solution A1, B2, D3
Second match The line crosses the y-axis at y = -2.
Solution B1, C2, A3
Third and fourth matches, C1 and D1: I have a problem to match the cards, because there are 2 possibilities when I use this strategy to find the value of y when x = 0, it is either C1 (b = 3) and D1 (b = 3). I can't go any further using this strategy.
Strategy 2: Solution determined by comparing the constant rates in the 3 representations.
I looked at the constant rates in the equations by looking at the coefficient of the variable x, the amount of change from one term to the next in the table of values, and compared the constant rate by looking at the change from one point to the next on the graph.
First match: A1 has a constant rate of 2 in the equation, which implies that the line (D3) increases at a rate of up 2 for every one unit over. Which also implies that, for each increase of one for the x value, the y value increases by 2 in the table of values (B2).
Solution: A1, B2, D3
Second match: B1 has a constant rate of 3 in the equation, which implies that the line (A3) will be more steep than the graph with the constant rate of 2. This also implies, that for each increase of one for the x value, the y value will increase by 3 in the table of values (C2).
Solution: A3, B1, C2
Third match: C1 has a constant rate of 0.5 in the equation, which implies that the line (C3) will be less steep thant the graph with the constant rate of 2. This also implies, that for each increase of one for the x value, the y value will incrase by 0.5 in the table of values (A2).
Solution: C1, A2, C3
Fourth match: D1 has a constant rate of 1.5 in the equation, which implies that the line will be more steeep than 0.5 but less than the graph with a constant rate of 2. This also implies, that for each increase of one for the x value, the y value will increase by 1.5 in the table of values (D2).
Solution: D1, D2, B3
Source: translated from En avant, les maths!, 7e année, CM, Algèbre, p. 5-7.
Activity 2: Creating a Linear Growing Pattern
Materials
- interlocking cubes;
- grid paper;
- blocks, square tiles, counters, etc.
Prepare 5 stations with manipulatives. At each station, have students create a linear growing pattern using the provided materials. Next while students are still at the station have them create a table of values, draw a graph and write an algebraic equation to define the relationship between the term number and the term value. Allow about 15 minutes per station. Take pictures and use the photos to discuss the patterns in class. Discuss strategies, vocabulary and different representations (materials, table of values, graphs and equations).
Note: For each pattern, students should be able to identify the initial value (Term Number 0) and the constant rate. If necessary, guide students.