D1.2 Collect data through observations, experiments, and interviews to answer questions of interest that focus on two pieces of information, and organize the data in two-way tally tables.
Skill: Collecting Data
After identifying the situation, students move on to the data collection stage. Since this stage can be complex for young students, they will need teacher guidance. In the following, a two-step approach is proposed:
- plan the data collection;
- collect and record data.
Plan the Data Collection
Proper planning of data collection is the best way to ensure that the data collected will be meaningful and will answer the question of interest that prompted the investigation. During this planning, it is important to consider:
- the target population;
- the type of inquiry;
- the kind of data sought;
- the method to be used for data collection.
Target Population
Students need to plan their inquiry with the target population in mind. For example, if a survey is for students in the classroom, it is relatively easy to access that population to collect data. It is only necessary to plan when to conduct the survey. However, if the survey is for students in another class, it is necessary to discuss with the teacher of that class when and how the data can be collected. In the Primary and Junior grades, teachers need to support students in these efforts.
When a survey is to be administered to a very large group (for example, the entire school), it is possible to limit the survey to a smaller number of people. This is called a sample. In the primary grades the size of the target population is usually small so students do not have to worry about selecting a sample.
Types of Inquiry
In the first step of the inquiry process, students have identified the problem situation and formulated a question of interest that they will attempt to answer. In doing so, students have typically determined whether the inquiry will be a survey, observations, measurements, a science experiment, a probability experiment, or using existing data.
The type of inquiry chosen will affect planning. For example, if students have chosen a survey, they need to plan how best to conduct the survey (for example, oral or written questionnaire). For other types of inquiries, students need to plan carefully how to collect the data to ensure that the data is accurate and valid (for example, how to make the observations or measurements, how to conduct the experiment).
Type of Data
In general, students need to determine whether they will be collecting qualitative or quantitative data, and whether this data is primary or secondary data. While students do not necessarily need to know this terminology, they need to be aware of the difference between these kinds of data in order to better plan their inquiry. The table below provides a summary of each of these kinds of data.
| Type of Data | Definition | Examples |
|---|---|---|
| Qualitative data | Data represented by words. |
|
| Quantitative data | Data represented by numbers. |
|
| Primary data | Data collected directly from the target population by the person or team conducting the inquiry. |
|
| Secondary data | Data collected by a person or organization other than the person doing the inquiry (for example, researcher, company, association). |
|
Data Collection Method
When planning an inquiry, students must devise a method that will be effective in collecting data. Deciding on a method of collecting data using concrete, semi-concrete or pictorial materials contributes to the development of data literacy.
Collect and Record Data
After planning the data collection, students should gather the necessary materials and organize them in a way that will facilitate the inquiry. Then, students proceed with the collection using the planned method. During this time, educators circulate among the students and encourage them to think about the inquiry process by asking questions such as:
- Is the investigation going according to plan?
- Are you getting the kind of data you expected? If not, what can you do to correct the situation?
- Are you sure you will get data for the entire target population? Why?
- Is the data collection method efficient and easy to use?
- How will you record the data collected?
Skill: Recording Data
Data recording can be done either after data collection or as the data is collected. As with data collection, it is important to allow students to use a personal mode of recording data before offering some of the more conventional modes of recording.
When students use personal modes of data recording, it is important to encourage them to evaluate the effectiveness of these recordings and compare modes to highlight the advantages and disadvantages of each. To do this, teachers can ask them questions such as:
- Do you find this method of recording data efficient? Why? (It's not really efficient because it takes a long time to draw all the objects.)
- Does this data record keep track of all the data? How do you know? (Yes, because each student's answer is written directly next to his or her name on the list. That way, we can be sure that no one is forgotten.)
- What do all of these records have in common? (In all of these records, each piece of data is represented by a drawing or symbol of some kind, which ensures that no data has been overlooked.)
- What is different about these records? (In some cases, the same symbol is used, while in others, different symbols are used.)
- Are there any records that you find easier to interpret than others? Why? (For example, students might say that some records seem easier to interpret because each piece of data is clearly represented in a table according to the category it belongs to. It is then easy to see which category contains the most data. However, other records would need to have the data reorganized a bit before they could be analyzed.)
As students develop an understanding of what makes a data recording mode effective, teachers can model the use of any of the following conventional modes:
- the simple table;
- the tally table.
Source: translated from Guide d’enseignement efficace des mathématiques, de la maternelle à la 3e année, Traitement des données et probabilité, p. 71-74.
Skill: Organizing Data
Organizing data and representing it in tables and graphs helps to communicate information for interpretation. Once students have identified the situation and collected data, they must organize the data.
Why Organize Data?
Gal (2002) indicates that inquiry data are organized for the purpose of analyzing or communicating information. Since the purpose of the inquiry is to find an answer to one or more questions of interest, it is very difficult to base that answer on data that are presented in a haphazard fashion. By organizing the data collected, it can be presented in a way that summarizes the data, highlights some of the information contained in the data, communicates key features of the data, and facilitates interpretation.
Source: translated from Guide d’enseignement efficace des mathématiques, de la maternelle à la 3e année, Traitement des données et probabilité, p. 62.
Knowledge: Question of Interest
When planning their inquiry, students should first ensure that they have a clear understanding of the situation. This can be done by clarifying the problem and posing one or more questions that can be answered with data. Students should also consider, to the extent possible, some of the factors of variability that may affect the outcome of the inquiry.
Clarify the Problem
Before solving a situational problem, educators must ensure that the problem is clearly understood by all the students. They can check this understanding and, if necessary, help them clarify the problem by facilitating an exchange of ideas about the situation.
Formulate Questions
Once you have a good understanding of what you are looking for or what you would like to know, you can start planning the inquiry. The first step is to clearly pose the question of interest, that is, the question that clarifies the intention of the inquiry. A question of interest is a question that can only be answered from variable data. So, 'How many children are there in your family?' is not a question of interest since the answer is fixed (for example, three children) and does not depend on variable data. On the other hand, 'How many children per family are there among the students in the class?' is a question of interest since to answer it, we must first collect data on the number of children in each student's family. In light of the answers obtained, we can then conclude, for example, that in the majority of the students' families, there are two children.
Konold and Higgins (2003, p. 195) argue that in the inquiry process, students' first challenge is to turn a general inquiry into a question of interest. Educators need to help students understand the importance of framing the question of interest correctly and ensuring that it accurately reflects what is being sought.
Students should also learn to recognize that the choice of question of interest affects the type of inquiry that should then be conducted. The following are examples of questions of interest that students might address in the primary, and junior grades, each accompanied by the type of inquiry it suggests.
| Question of Interest | Type of Inquiry |
|---|---|
| What are the three favorite varieties of apples of the students in Mrs. Pommerleau's class? | Survey |
| How many servings of vegetables and fruit do the students in the class eat in a day? | Observation |
| How many bounces does a table tennis ball make when dropped from a height of one meter? | Scientific experiment |
| If a Styrofoam cup is dropped, is it more likely to land upright, upside down, or sideways? | Probability experiment |
| Which month of the year has the most precipitation? | Secondary data collection |
As reflected in the Mathematics Curriculum, students develop the ability to formulate survey questions as they progress through the grades. For example, in Grade 1, students are asked to write survey questions that require a yes or no answer (for example, 'Do you like cats?'). Then, through Grade 4, they are asked to formulate survey questions with a limited number of answers.
In the Primary and Junior levels, teachers must therefore provide students with a variety of situations that require investigation through a survey.
Teachers can help students develop the skill of formulating a survey question by asking questions such as:
- Is the question easy to understand?
- Should it be reworded to better target the type of response desired?
- Should we limit the number of different answers possible?
- Will the expected answers allow us to answer the question of interest?
In summary, to help students develop the ability to formulate a question of interest or a survey question, teachers should lead them to:
- clarify the problem;
- specify the information needed to solve it;
- ensure that the question of interest and the survey question generate this type of information;
- think about the possible interpretations of their questions;
- ensure that the survey question is consistent with the issue of interest and generates a limited number of responses.
Source: translated from Guide d’enseignement efficace des mathématiques, de la maternelle à la 3e année, Traitement des données et probabilité, p. 60-64.
Knowledge: Data Collection Through Observation
In data collection by observation, one records what one sees or does.
Examples
- We count the number of birds we see in the schoolyard at specific times.
- The number of cars passing through an intersection during a given time interval is noted.
- The number of times one goes to the park in a week is tallied.
- Every day for a week, the time at which one goes to bed and gets up is documented.
In planning data collection by observation, it is necessary to plan where, when, what, and sometimes how to observe (for example, how to distinguish between a car making an incomplete stop at an intersection and a car making no stop). It is also possible to plan whether all observations will be made by one person or whether they will be made by several people at the same time to ensure better reliability.
Source: translated from Guide d’enseignement efficace des mathématiques, de la maternelle à la 3e année, Traitement des données et probabilité, p. 46.
Knowledge: Data Collection by Means of an Experiment
In a data collection by means of an experiment , the data comes from a manipulation activity that requires adherence to certain pre-established parameters such as a precise measurement tool or a determined frequency.
Examples
- At specific intervals, plants are measured for growth, with some receiving a small amount of nutrients, some receiving a larger amount, and some receiving no nutrients, to see if nutrients are contributing significantly to plant growth.
- In an investigation using a probability experiment, a team spins the arrow of a spinner 15 times and notes, with a check mark (√), each outcome in the appropriate place in a table.
In planning a data collection by means of an experiment , the scientific approach must be used and the reliability of the data collection method must be ensured. Variables that may render the results invalid must be controlled and neutralized.
Source: translated from Guide d’enseignement efficace des mathématiques, de la maternelle à la 3e année, Traitement des données et probabilité, p. 47.
Knowledge: Survey
A survey is the most common type of inquiry used by students in the primary grades. It requires the formulation of one or more questions to be asked during the survey. These questions are usually closely related to the question of interest. The formulation of the survey question depends largely on the type of information sought. In a survey, there are generally four types of information: preference, quantity, size, and general information.
| Type of Information | Sample Questions | Information Sought |
|---|---|---|
| Preference |
Do you like to read adventure stories? Which of the following 15 activities is your favorite? |
These questions invite respondents to express a personal choice. |
| Quantity |
How many buttons are there on your coat? Of the following 15 activities, how many would you like to participate in? |
These questions seek count information, often in response to a question beginning with “how many”. |
| Size | How many seconds does it take you to complete the 100 meter race? | These questions target data relating to units of measurement. |
| General information |
Do you have a cat at home? In which country were you born? |
These questions target a variety of information that is not quantitative in nature and does not reflect a preference on the part of the respondents. |
Source: translated from Guide d’enseignement efficace des mathématiques, de la maternelle à la 3e année, Traitement des données et probabilité, p. 62.
In a survey, data are collected by asking a number of individuals about a particular topic. The questions often take the form of a questionnaire that can be answered in writing or orally.
Examples
- Students in the class are asked how many hours they spend watching television each week.
- Grade 6 students are asked about their favourite music genres.
In planning a survey, it is important to write the survey questions well to ensure that they are clear and objective. It is also important to anticipate the responses that may be given and sometimes to group them into categories.
Source: translated from Guide d’enseignement efficace des mathématiques, de la maternelle à la 3e année, Traitement des données et probabilité, p. 47-48.
Knowledge: Two-Way Tally Table
A table giving the observed frequency or count of two variables, with the rows indicating one category and the columns indicating the other category.
A two-way tally table can be used to collect and organize data involving two attributes. Data are recorded using tally marks to facilitate counting.
Example
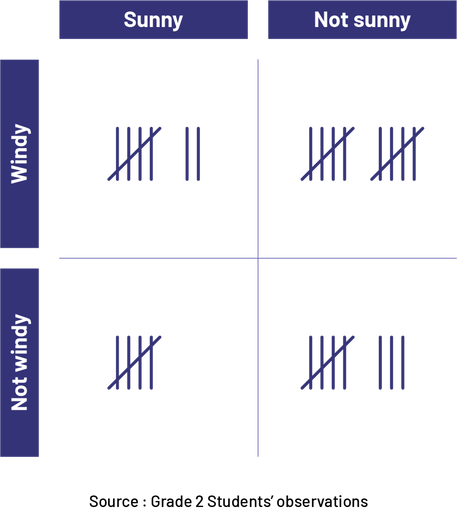 Image The source of the table comes from the observations of the students in grade two. The table contains two columns and two rows. In the box corresponding to both the column named 'Sunny' and the row named 'Windy', there are seven sticks. In the box corresponding to the column named 'Not Sunny' and the row named 'Windy', there are ten sticks. In the box corresponding to the column named 'Sunny' and the row named 'Not Windy', there are five sticks. And in the box corresponding to the column named 'Not Sunny' and the row named 'Not Windy', there are eight sticks.
Source: The Ontario Curriculum. Mathematics, Grades 1-8 Ontario Ministry of Education, 2020.