D1.4 Identify the mode(s), if any, for various data sets presented in concrete graphs, pictographs, line plots, bar graphs, and tables, and explain what this measure indicates about the data.
Skill: Explaining What the Mode(s) Indicate About the Data
Statistical measures are numbers used to describe a set of data. For example, the mode is a statistical measure. Statistical measures are presented as part of the fourth step in the inquiry process, interpreting the results, because they are another way of attributing meaning to the data and can provide information on which to base a decision.
Various statistical measures are commonly used in data processing. Those studied in the primary grades are the mode (from Grade 2) and the mean (from Grade 3). Students need to understand what each represents in order to select, determine and use them appropriately.
Source: translated from Guide d’enseignement efficace des mathématiques, de la 4e à la 6e année, Traitement des données et probabilité, p. 107.
Knowledge: Mode
The mode of a dataset represents the data with the greatest frequency, that is, the data item(s) that appear most often. The mode is particularly significant in inquiry contexts where one seeks to determine what is the most popular, the most sold, the most frequent, etc. As shown in the examples below, it is possible to determine the mode of a set of quantitative or qualitative data.
Example 1
The table below shows the data corresponding to the number of children in the families of the students in the class. It can be seen that the most frequent response is 2, indicating that there are more families with two children. The mode of this quantitative set of data is 2 children per family.
| Number of Children in the Family | Number of Students |
|---|---|
| 1 | 3 |
| 2 | 12 |
| 3 | 6 |
| 4 | 3 |
| more than 4 | 2 |
Example 2
The next graph represents the preferred colours of the students in the class. To determine the mode of this qualitative data, we need only look at the length of the bars. We see that the red and blue bars are of equal length and are longer than all the others. In this case, there are two modes, red and blue.
 Image Vertical bar graph, titled Students’ Favourite Colours, consisting of a yellow bar, a red bar, a green bar, a blue bar and a purple bar. Title of the vertical axis: Number of students The vertical axis is numbered from 0 to 6. Title of the horizontal axis: Colors Yellow: 4 students Red: 5 students Green: 3 students Blue: 5 students Other: 4 students The mode is red and blue.
When using the mode to answer a question of interest or to make a decision, it is important to consider the entire data set. This is because in some situations, the most frequent data is not necessarily the one that makes the most sense of the data. It is important to encourage students to investigate every situation closely before making conclusions based on the mode. For example:
- In Example 1 above, the two children per family mode seems fairly representative of the situation since there is a significant difference between this frequency and the others.
- In Example 2 above, not only are there two modes (red and blue), but the difference between their frequency and the other frequencies is not very large, so it is difficult to conclude that these two modes represent a strong colour preference. In this case, it would be better to mention that red and blue are slightly more popular, but that yellow follows closely behind.
- For the line plot below, the mode corresponds to 60 heartbeats per minute. We can see that this number is far from the range that accounts for most of the data (69 to 77). Also, we can see that the overall range is large (29), and the values appear only once, twice, or three times each, so it would be best not to use the mode to make a conclusion about this set of data.
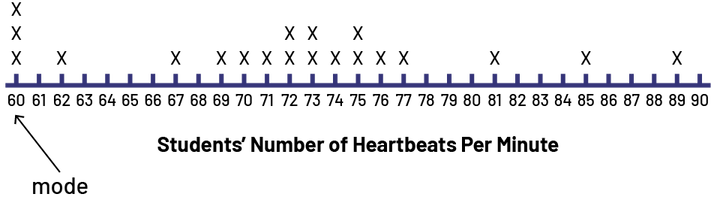 Image Number line, titled Students’ Number of Heartbeats Per Minute, numbered from 60 to 90, 60 being the mode. 60 beats: three Xs 62 beats: one X 67 beats: one X 69 beats: one X 70 beats: one X 71 beats: one X 72 beats: two Xs 73 beats: two Xs 74 beats: one X 75 beats: two Xs 76 beats: one X 77 beats: one X 81 beats: one X 85 beats: one X 89 beats: one X
Source: translated from Guide d’enseignement efficace des mathématiques, de la 4e à la 6e année, Traitement des données et probabilité, p. 108-111.