D1.4 Identify the mode(s), if any, for various data sets presented in concrete graphs, pictographs, line plots, bar graphs, and tables, and explain what this measure indicates about the data.
Activity 1: Determine the Mode
Explain to students that during a data collection, each student in a Grade 2 class was asked to provide a pencil of their favourite colour.
Here is the result of the data collection.

Invite students to represent the data in a tally chart to help organize and interpret the data.
Ask the following questions:
- What is the mode (or modes) for this set of data?
- What does the mode(s) tell us about the data?
- Does the mode accurately represent the preferred colour of the students in the class?
Activity 2: Determine the Mode
A Grade 2 teacher surveyed her students to find out their favourite school activity. Here is a line plot that shows the results of her survey.
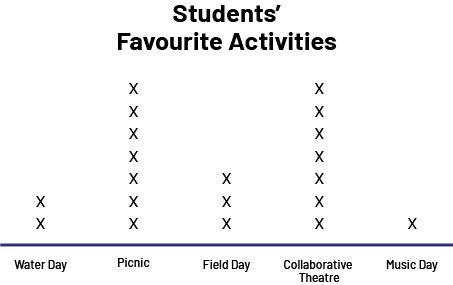 Image Number line with the title Champlain Students’ Favourite Activities. The horizontal axis
shows five categories:
Water Day, Picnic, Field Day, Collaborative Theatre and Music Day. Water Day: two Xs Picnic: seven Xs Field Day: 3 Xs
Collaborative Theatre: seven Xs Music Day: one X.
Image Number line with the title Champlain Students’ Favourite Activities. The horizontal axis
shows five categories:
Water Day, Picnic, Field Day, Collaborative Theatre and Music Day. Water Day: two Xs Picnic: seven Xs Field Day: 3 Xs
Collaborative Theatre: seven Xs Music Day: one X.
Ask students to determine the mode of this data set. Ask questions such as:
- What does this data set reveal?
- What does the mode(s) tell us about the data?