D1.6 Analyse different sets of data presented in various ways, including in stacked-bar graphs and in misleading graphs, by asking and answering questions about the data, challenging preconceived notions, and drawing conclusions, then make convincing arguments and informed decisions.
Activity 1: Analysis of a Stacked-Bar Graph
Have students conduct a survey of a set of students in the school, according to their grade, and present the results in a stacked-bar graph.
 image
The stacked bar graph is titled "Pets of Students in Grades one to 6". The horizontal axis corresponds to pets while
the vertical axis, graduated from zero to 95, is for the number of students. The yellow portion of the bar corresponds
to students in grades one to three, while the blue portion corresponds to students in grades four to six. No pet: blue
bar at 35, yellow bar at 75. Other animal: blue bar at eleven, yellow bar at 20. Fish: blue bar between 5 and 10,
yellow bar at 20. Bird: blue bar between zero and five, yellow bar between 5 and ten. Cat: blue bar at 30, yellow bar
between 65 and 70. Dog: blue bar at 45, yellow bar between 80 and 85.
image
The stacked bar graph is titled "Pets of Students in Grades one to 6". The horizontal axis corresponds to pets while
the vertical axis, graduated from zero to 95, is for the number of students. The yellow portion of the bar corresponds
to students in grades one to three, while the blue portion corresponds to students in grades four to six. No pet: blue
bar at 35, yellow bar at 75. Other animal: blue bar at eleven, yellow bar at 20. Fish: blue bar between 5 and 10,
yellow bar at 20. Bird: blue bar between zero and five, yellow bar between 5 and ten. Cat: blue bar at 30, yellow bar
between 65 and 70. Dog: blue bar at 45, yellow bar between 80 and 85.
Reading the data
Relevant questions:
- What is the graph about? (The pets of students in grades 1-6.)
- How many students in grades 4-6 do not have any pets? (There are 35 students in grades 4-6 who do not have any pets. This can be seen from the first blue bar directly to the right of the vertical axis.)
- How many students in grades 1-3 have no pets? (To find the answer, refer to the first yellow bar directly to the right of the vertical axis, stacked on top of the blue bar. Since there are 75 students in grades 1-6 who have no pets, subtract the 35 students in grades 4-6 from the 75 students. That said, 40 students in grades 1-3 have no pets.)
- How many categories are there? (There are 6 categories.)
- What is the scale on the vertical axis? (The vertical axis is graduated from 0 to 95, in intervals of 5.)
- What does the horizontal axis represent in this stacked-bar graph? (The horizontal axis represents the categories of pets.)
- What does the longest blue bar represent? (It represents the number of students in grades 4 to 6 who have a dog as a pet.)
Reading between the Data
Relevant questions:
- What is the most common pet for students in grades 1 to 3? For students in grades 4 to 6? (For primary students, the most common pet is a dog: 42 students (88 students in grades 1 to 6 - 46 students in grades 4 to 6 = 42 students in grades 1 to 3). For junior students, it is also a dog: 46 students.)
- Do more students own a cat than the total number of students who own a fish or other animal?(Yes, there are more students who have a cat than students who have a fish or other animal, as 67 students have a cat, while 25 students have a fish and 20 students have another animal, for a total of 45 students.)
- According to Canadian research, cats followed by dogs are the two most popular pets in Canada. Is this the case for the students surveyed? (No, because if you read the data for each category in the graph, you get, in descending order, 88 students who have a dog, 75 students who have no pets, 67 students who have a cat, 25 students who have a fish, 20 students who have some other pet, and 8 students who have a bird. Dogs are therefore more popular than cats among students in grades 1-6, in contrast to cats, which are the most popular in Canada.)
Reading Beyond the Data
Relevant questions:
- Is a dog the most common pet in the Kindergarten class groups?(This is possible because the graph shows that many more students in grades 1-6 have a dog as a pet. Thus, we are likely to get the same result for Kindergarten students) or (We can't tell from the survey because it was only conducted with students in grades 1-6 and we know that students' tastes may be different at different ages)
- If the survey is repeated with other response choices, will the results be similar?(Yes, if the dog is retained as a response choice. This choice is still likely to have the highest frequency. However, if the dog is not one of the animals presented, the "other animal" category may have the highest frequency.)
- What other questions can be asked from the graph?(Comparing the Primary and Junior students, in which category is there the greatest difference? the least difference? What animals might be in the "other animal" category?)
Source: adapted and translated from Guide d’enseignement efficace des mathématiques, de la 4e à la 6e année, Traitement des données et probabilité, p. 91-97.
Activity 2: Decision Making
A staff member suggests that the students turn a corner of the schoolyard into a vegetable garden where they can grow three types of vegetables. The students then decide to conduct a survey to find out which vegetable is the favourite of the Grade 4 and 5 students. The results of the survey are shown in the following stacked-bar graph.
 image
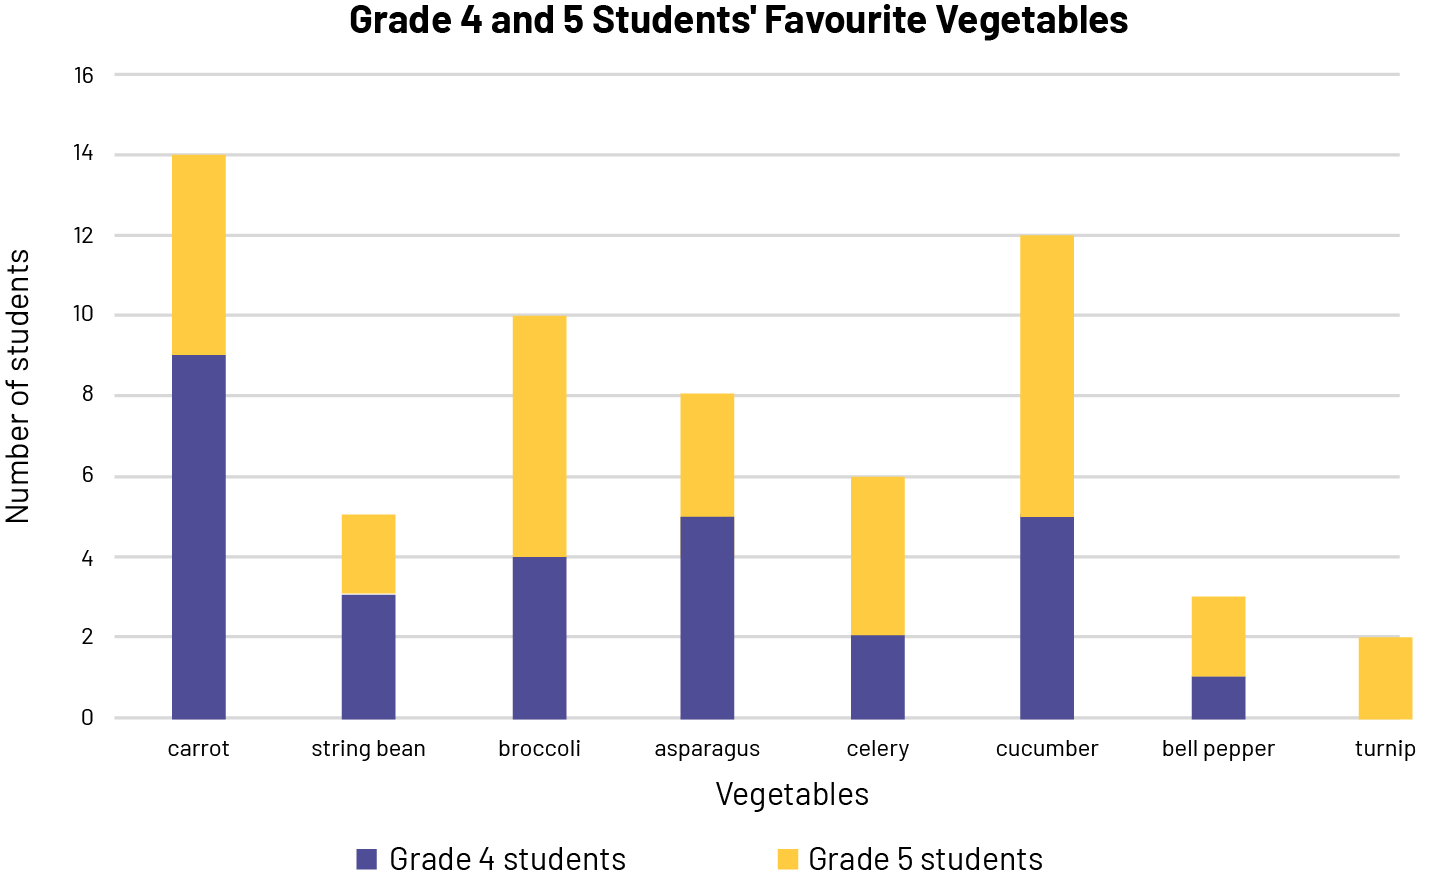
The stacked bar graph is titled " Favourite Vegetables of Students in Grades 4 and 5". The horizontal axis corresponds
to the vegetables while the vertical axis, graduated from zero to 16, is for the number of students. The blue portion
of the bar corresponds to students in grade 4, while the yellow portion corresponds to students in grade 5. Carrot:
blue bar at 9, yellow bar at 14. Bean: blue bar at three, yellow bar at five. Broccoli: blue bar at four, yellow bar
at ten. Asparagus: blue bar at five, yellow bar at eight. Celery: blue bar at two, yellow bar at six. Cucumber: blue
bar at five, yellow bar at twelve. Bell pepper: blue bar at one, yellow bar at three. Turnip: no blue bar, yellow bar
at two.
image
The stacked bar graph is titled " Favourite Vegetables of Students in Grades 4 and 5". The horizontal axis corresponds
to the vegetables while the vertical axis, graduated from zero to 16, is for the number of students. The blue portion
of the bar corresponds to students in grade 4, while the yellow portion corresponds to students in grade 5. Carrot:
blue bar at 9, yellow bar at 14. Bean: blue bar at three, yellow bar at five. Broccoli: blue bar at four, yellow bar
at ten. Asparagus: blue bar at five, yellow bar at eight. Celery: blue bar at two, yellow bar at six. Cucumber: blue
bar at five, yellow bar at twelve. Bell pepper: blue bar at one, yellow bar at three. Turnip: no blue bar, yellow bar
at two.
After students have done the first part of interpreting the results, assigning meaning to the data, teachers invite them to make a decision by asking questions such as:
- Do the results presented in the stacked-bar graph answer the original question? (Yes, we can see that the favourite vegetable of Grade 4 students is carrots and the favourite vegetable of Grade 5 students is cucumbers.)
- Considering the preferences of Grade 4 students, what three vegetables should be grown in the garden? (Carrots, asparagus and cucumbers should be grown.)
- Considering the preferences of Grade 5 students, what three vegetables should be grown in the garden? (Cucumbers, broccoli and carrots should be grown.)
- Considering both Grades 4 and 5 preferences, what three vegetables should be grown in the garden? (Cucumbers, broccoli and carrots should be grown.)
- If you decide to add two more vegetables, which ones should you add? (You should add asparagus and celery.)
- Do you think that the results of this survey can be used to purchase three vegetables for snacks for students in both classes? (Yes, because we know which vegetables are preferred by students in both classes.)
In this situation, we see that the interpretation of the results allowed students to:
- answer the question of interest that prompted the survey (What is the favourite vegetable of Grade 4 and Grade 5 students?);
- make decisions about planning the garden (What three vegetables should be grown in the garden?);
- determine if the data can be used in a context other than the one presented at the beginning (What three vegetables should I buy for a snack?).
Source: adapted and translated from Guide d’enseignement efficace des mathématiques, de la 4e à la 6e année, Traitement des données et probabilité, p. 101-104.
Activity 3: Misleading Graph
Teachers present students with the following graph from a trade magazine.
 image
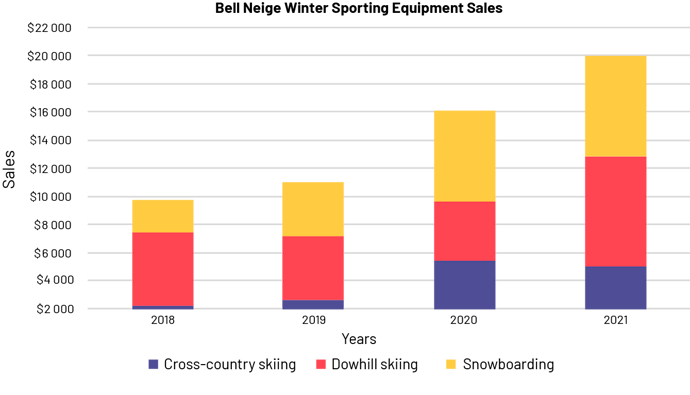
The stacked bar graph is titled "Belle Neige Winter Sports Equipment Sales. The horizontal axis corresponds to years,
while the vertical axis, graduated from $2000 to $22 000, corresponds to sales. The blue portion of the bar
corresponds to cross-country skis, the red portion corresponds to alpine skis, and the yellow portion corresponds to
snowboarding. 2018: blue bar slightly above $2000, red bar between $7000 and $8000, and yellow bar slightly below $10
000. 2019: blue bar between 2000 and 3000, red bar at 7000, yellow bar at 11 000. 2020: blue bar between 5000 and
6000, red bar slightly below 10 000, yellow bar at 16 000. 2021: blue bar at 5000, red bar at 13 000, and yellow bar
at 20 000.
image
The stacked bar graph is titled "Belle Neige Winter Sports Equipment Sales. The horizontal axis corresponds to years,
while the vertical axis, graduated from $2000 to $22 000, corresponds to sales. The blue portion of the bar
corresponds to cross-country skis, the red portion corresponds to alpine skis, and the yellow portion corresponds to
snowboarding. 2018: blue bar slightly above $2000, red bar between $7000 and $8000, and yellow bar slightly below $10
000. 2019: blue bar between 2000 and 3000, red bar at 7000, yellow bar at 11 000. 2020: blue bar between 5000 and
6000, red bar slightly below 10 000, yellow bar at 16 000. 2021: blue bar at 5000, red bar at 13 000, and yellow bar
at 20 000.
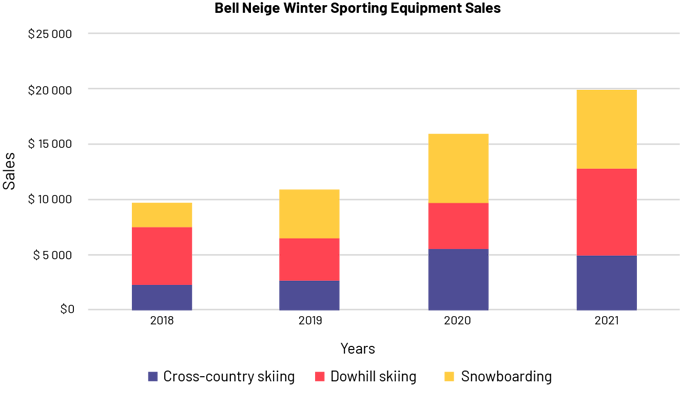
Teachers can assist students to interpret the data by asking questions such as "From the chart, cross-country ski sales appear to have doubled from 2018 to 2019. Do you agree?" Students should be able to recognize that although the blue bar is twice as tall, in 2019, in reality cross-country ski sales in 2018 are about $2000 and sales in 2019 are about $2500, so they have not doubled. It is important to discuss how this graph is not incorrect per se, because it represents the data accurately. However, it can lead to false and misleading impressions. Teachers can then lead students to recognize that, to represent the data without misleading anyone, it would be better to scale the vertical axis from 0 to 25 000 as follows.
 image
The stacked bar graph is titled "Belle Neige Winter Sports Equipment Sales. The horizontal axis corresponds to years,
while the vertical axis, graduated from $2,000 to $22,000, corresponds to sales. The blue portion of the bar
corresponds to cross-country skis, the red portion corresponds to alpine skis, and the yellow portion corresponds to
snowboarding. 2018: blue bar slightly above $2,000, red bar between $7,000 and $8,000, and yellow bar slightly below
$10,000. 2019: blue bar between 2,000 and 3,000, red bar at 7,000, yellow bar at 11,000. 2020: blue bar between 5,000
and 6,000, red bar slightly below 10,000, yellow bar at 16,000. 2021: blue bar at 5,000, red bar at 13,000, and yellow
bar at 20,000.
image
The stacked bar graph is titled "Belle Neige Winter Sports Equipment Sales. The horizontal axis corresponds to years,
while the vertical axis, graduated from $2,000 to $22,000, corresponds to sales. The blue portion of the bar
corresponds to cross-country skis, the red portion corresponds to alpine skis, and the yellow portion corresponds to
snowboarding. 2018: blue bar slightly above $2,000, red bar between $7,000 and $8,000, and yellow bar slightly below
$10,000. 2019: blue bar between 2,000 and 3,000, red bar at 7,000, yellow bar at 11,000. 2020: blue bar between 5,000
and 6,000, red bar slightly below 10,000, yellow bar at 16,000. 2021: blue bar at 5,000, red bar at 13,000, and yellow
bar at 20,000.
In this new graph, since the heights of the bands are proportional to sales, the data picture is more accurate. We can now see that cross-country ski sales did not double from 2018 to 2019. However, we can see that they more than doubled from 2019 to 2020.
Source: adapted and translated from Guide d’enseignement efficace des mathématiques, de la 4e à la 6e année, Traitement des données et probabilité, p. 105-106.