D2. Probability:
Describe the likelihood that events will happen, and use that information to make predictions.
Learning Situation: Theoretical and Experimental Probabilities of Independent Events
Total duration: approximately 120 minutes
Summary
In this learning situation, students solve probability problems by comparing theoretical probabilities with experimental probabilities of independent events.
| Overtall Expectations | Specific Expectations |
|---|---|
|
B1. Number Sense: demonstrate an understanding of numbers and make connections to the way numbers are used in everyday life. |
B1.3 compare and order integers, decimal numbers, and fractions, separately and in combination, in various contexts. |
|
B2. Operations: use knowledge of numbers and operations to solve mathematical problems encountered in everyday life. |
B2.1 use the properties of operations, and the relationships between operations, to solve problems involving whole numbers, decimal numbers, fractions, ratios, rates, and whole number percents, including those requiring multiple steps or multiple operations. |
|
D.2 Probability: describe the likelihood that events will happen, and use that information to make predictions. |
D2.2 determine and compare the theoretical and experimental probabilities of two independent events happening. |
Points of Observation
The student:
- determines the probability of an event using a tree diagram;
- determines the experimental probability of an event by performing an experiment;
- demonstrates an understanding of the relationship between a fraction, a decimal number, and a percent.
Materials
- die
- playing cards
- opaque bag (into which the cards will go)
- lined or blank paper
- pencil and eraser
- coin
- spinner with a shaded sector
Guided Exploration
Course of Action
- Introduce students to Example 1, a probability situation with a die in which the student must find and compare the theoretical probability and the experimental probability.
- Allow students the time required to complete the assignment. At this stage, students will discover various strategies for finding the theoretical and experimental probability of two independent events.
- Ask a few students to share their solution with the class and explain the strategies they used to find the theoretical probability. Ask them how they did the experiment and how they recorded the probability. Invite other students to ask questions to check their understanding.
- Following the discussions, ensure that students make connections between the theoretical probability, the experimental probability, and the probability line.
- Encourage students to improve their work by adding missing elements.
- Another learning opportunity is presented in Example 2, a probability problem with playing cards in which students must first find the theoretical probability and then the experimental probability by doing the experiment.
Example 1
Three friends, Elias, Joyce and Vincent, have decided to invent a game. The game involves rolling a die twice in a row. The winner is determined as follows:
- if both throws are odd numbers, Elias gets a point;
- if both throws are multiples of three, Joyce gets a point;
- if both throws are numbers greater than three, Vincent gets a point.
Determine the theoretical and experimental probability of these events. Who has the best chance of winning this game?
Strategy 1 – Theoretical Probability
I count the possible outcomes using a tree diagram.
 image
Six branches unfold from the set of names Elias, Joyce and Vincent. They correspond to the first throw and are
numbered from one to six. At each of these, six branches unfold; they correspond to the second throw. Elias gets three
red check marks for branch sets one, three and five, for a total of 9. Joyce gets two red check marks for branch sets
three and five, for a total of four. Her check marks are framed in purple. Vincent gets three red check marks for
branch sets four, five and six for a total of nine. His check marks are framed in yellow. The tree indicates that
there are 36 possible results.
image
Six branches unfold from the set of names Elias, Joyce and Vincent. They correspond to the first throw and are
numbered from one to six. At each of these, six branches unfold; they correspond to the second throw. Elias gets three
red check marks for branch sets one, three and five, for a total of 9. Joyce gets two red check marks for branch sets
three and five, for a total of four. Her check marks are framed in purple. Vincent gets three red check marks for
branch sets four, five and six for a total of nine. His check marks are framed in yellow. The tree indicates that
there are 36 possible results.
\(P(Elias\ wins)=\frac{number\ of\ favorable\ outcomes}{total\ number\ of\ possible\ outcomes}\) \(=\ \frac{9}{36}\)
I know that 9 is a common factor of 9 and 36, so I can reduce the fraction by finding an equivalent fraction.
\(\frac{9\ \div\ 9}{36\ \div\ 9}=\frac{1}{4}\)
I know I can find the decimal number by dividing the numerator by the denominator.
\(1\div 4=0.25\)
To determine the percent, I have to multiply by 100.
\(0.25\times 100 = 25\%\)
The theoretical probability of Elias winning is low. It is 25%.
\(P(Joyce\ wins)=\frac{number\ of\ favorable\ outcomes}{total\ number\ of\ possible\ outcomes}\) \(=\ \frac{4}{36}\)
I know that 4 is a common factor of 4 and 36, so I can reduce the fraction by finding an equivalent fraction.
\(\frac{4\ \div\ 4}{36\ \div\ 4}=\frac{1}{9}\)
I know I can find the decimal number by dividing the numerator by the denominator.
\(1\div 9=0.111\)
To determine the percent, I have to multiply by 100.
\(0.111\times 100=11.1\%\)
The theoretical probability of Joyce winning is very low, about 11.1%.
\(P(Vincent\ wins)=\frac{number\ of\ favorable\ outcomes}{total\ number\ of\ possible\ outcomes}\) \(=\ \frac{9}{36}\)
The theoretical probability that Vincent wins is 25%.
Elias and Vincent have the best chance of winning since their theoretical probability of winning, at 25%, is higher than Joyce's.
Strategy 2 – Experimental Probability
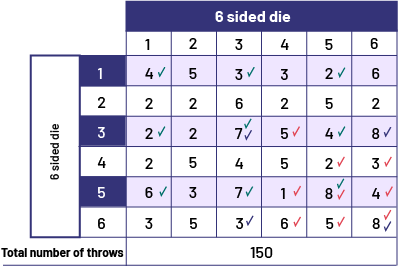
I will perform the experiment using a six-sided die that I will roll twice in a row, 150 times in all. I will record the results in the probability table and then record the total for each combination.
Here is an example of a table:
 image
The one-one combination has a result of 4, with a green check mark. The combination one-two has a result of five. The
combination one-three has a result of three, with a green check mark. The combination one-four has a result of three.
The combination one-five has a result of two, with a green check mark. The combination one-six has a result of six.
The combination two-one has a result of two. The combination two-two has a result of two. The combination two-three
has a result of six. The combination two-four has a result of two. The combination two-five has a result of five. The
combination two-six has a result of two. The three-one combination has a result of two, with a green check mark. The
three-two combination has a result of two. The three-three combination has a result of seven, with a green and a blue
check marks. The three-four combination has a score of five, with a red check mark. The three-five combination has a
result of four, with a green check mark. The combination three-six has a result of eight, with a blue check mark. The
four-one combination has a result of two. The combination four-two has a result of five. The four-three combination
has a result of four. The four-four combination has a result of five. The four-five combination has a result of two,
with a red check mark. The combination four-six has a result of three, with a red check mark. The combination five-one
has a result of six, with a green check mark. The combination five-two has a result of three. Five-three has a score
of seven, with a green check mark. Five-four has a score of one, with a red check mark. The combination five-five has
a result of eight, with a green and a red check marks. The combination five-six has a result of four, with a red check
mark. The combination six-one has a result of three. The combination six-two has a result of five. The combination
six-three has a result of three, with a blue check mark. The combination six-four has a result of six, with a red
check mark. The combination six-five has a result of five, with a red check mark. And the combination six-six has a
result of eight, with a red and a blue check marks.
image
The one-one combination has a result of 4, with a green check mark. The combination one-two has a result of five. The
combination one-three has a result of three, with a green check mark. The combination one-four has a result of three.
The combination one-five has a result of two, with a green check mark. The combination one-six has a result of six.
The combination two-one has a result of two. The combination two-two has a result of two. The combination two-three
has a result of six. The combination two-four has a result of two. The combination two-five has a result of five. The
combination two-six has a result of two. The three-one combination has a result of two, with a green check mark. The
three-two combination has a result of two. The three-three combination has a result of seven, with a green and a blue
check marks. The three-four combination has a score of five, with a red check mark. The three-five combination has a
result of four, with a green check mark. The combination three-six has a result of eight, with a blue check mark. The
four-one combination has a result of two. The combination four-two has a result of five. The four-three combination
has a result of four. The four-four combination has a result of five. The four-five combination has a result of two,
with a red check mark. The combination four-six has a result of three, with a red check mark. The combination five-one
has a result of six, with a green check mark. The combination five-two has a result of three. Five-three has a score
of seven, with a green check mark. Five-four has a score of one, with a red check mark. The combination five-five has
a result of eight, with a green and a red check marks. The combination five-six has a result of four, with a red check
mark. The combination six-one has a result of three. The combination six-two has a result of five. The combination
six-three has a result of three, with a blue check mark. The combination six-four has a result of six, with a red
check mark. The combination six-five has a result of five, with a red check mark. And the combination six-six has a
result of eight, with a red and a blue check marks.
\(P(Elias\ wins)=\frac{number\ of favorable\ trials}{total\ number\ of trials}\) \(=\ \frac{4\ +\ 3\ +\ 2\ +\ 2\ +\ 7\ +\ 4\ +\ 6\ +\ 7\ +\ 8}{150}\) \(=\ \frac{43}{150}=0.287=28.7\%\)
\(P(Joyce\ wins)=\frac{number\ of favorable\ trials}{total\ number of trials}\) \(=\ \frac{7\ +\ 8\ +\ 3\ +\ 8}{150}\) \(=\ \frac{26}{150}=0.173=17.3\%\)
\(P(Vincent\ wins)=\frac{number\ of favorable\ trials}{total\ number\ of trials}\) \(=\ \frac{5\ +\ 2\ +\ 3\ +\ 1\ +\ 8\ +\ 4\ +\ 6\ +\ 5\ +\ 8}{150}\) \(=\ \frac{42}{150}=0.28= 28\%\)
According to the results I got from the experiment, the experimental probability of Elias winning is about 28.7%, Joyce's is about 17.3%, and Vincent's is 28%. So, Elias and Vincent have the best chance of winning at this game.
Example 2
There are three different cards in a bag: the six of clubs, the nine of hearts and the four of spades. Pietro draws one card from the bag, puts it back in the bag and draws a second card. He wins if he draws two cards in a row that are multiples of two or if he draws the same card twice.
Determine the theoretical probability that Pietro wins.
What is the experimental probability of this event?
Strategy 1 – Theoretical Probability
I count the possible outcomes using a tree diagram.
 image Legend: C equals clubs, H equals hearts, and S equals spades. The diagram starts from the name
Pietro, from which three branches unfold. They correspond to First Try, first draw. The first one gives six C, the
second one gives 9 H and the third one gives four S. From each of the three branches, three more branches unfold: 6
C, 9 H, four S. They correspond to Second Try, Second draw. Then comes the column of possible results. In order: 6 C
and 6 C. 6 C and 9 H. 6 C and 4 S. 9 H and 6 S. 9 H and 9 H. 9 H and 4 S. Four S and 6 C. 4 S and 9 H. 4 S and 4 S.
Then comes the column "Favourable results". A red check mark is placed next to the following results: 6 C and 6 C. 6
C and 4 S. 9 H and 9 H. 4 S and 6 C. Four S and 4 S. The tree indicates that there are 9 possible results.
image Legend: C equals clubs, H equals hearts, and S equals spades. The diagram starts from the name
Pietro, from which three branches unfold. They correspond to First Try, first draw. The first one gives six C, the
second one gives 9 H and the third one gives four S. From each of the three branches, three more branches unfold: 6
C, 9 H, four S. They correspond to Second Try, Second draw. Then comes the column of possible results. In order: 6 C
and 6 C. 6 C and 9 H. 6 C and 4 S. 9 H and 6 S. 9 H and 9 H. 9 H and 4 S. Four S and 6 C. 4 S and 9 H. 4 S and 4 S.
Then comes the column "Favourable results". A red check mark is placed next to the following results: 6 C and 6 C. 6
C and 4 S. 9 H and 9 H. 4 S and 6 C. Four S and 4 S. The tree indicates that there are 9 possible results.
\(P(Pietro\ wins)=\frac{number\ of\ favorable\ outcomes}{total\ number\ of\ possible\ outcomes}\) \(=\ \frac{5}{9}= 0.556 = 55.6\%\)
The theoretical probability of Pietro winning is about 55.6%.
Strategy 2 – Experimental Probability
This is a situation in which playing cards are used. I take the three cards needed and place them in an opaque bag. I draw a card and note the result. I put the card back in the bag. Then I draw a second card, note the result and put the card back in the bag. I repeat the experiment 40 times to determine the experimental probability of the event.
Here is an example of a table:
| Playing Cards | ||||
| Six of clubs | Nine of hearts | Four of spades | ||
| Playing cards | Six of clubs | 2 | 6 | 4 |
| Nine of hearts | 6 | 4 | 3 | |
| Four of spades | 4 | 5 | 6 | |
| Total number of trials | 40 | |||
\(P(Pietro\ wins)=\frac{number\ of favorable\ trials}{total\ number\ of \ trials}\) \(=\ \frac{2\ +\ 4\ +\ 4\ +\ 4\ +\ 6}{40}\) \(=\ \frac{20}{40}= 0.5= 50\%\)
According to the results I obtained in the experiment, the experimental probability of winning this game is 50%.
Source: translated from En avant, les maths!, 6e année, ML, Données, p. 9.