D2.2 Determine and compare the theoretical and experimental probabilities of two independent events happening and of two dependent events happening.
Activity 1: Determining Theoretical and Experimental Probabilities
Using a deck with the following cards:
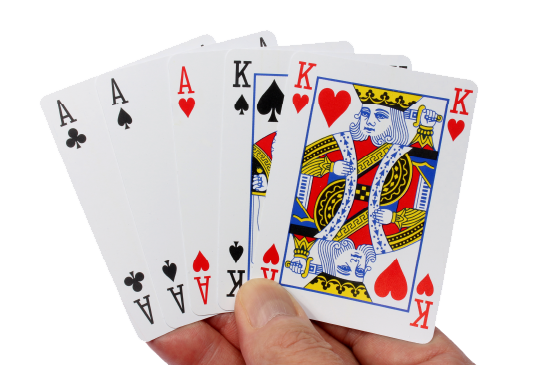 Image A person holds five playing cards in their hand: an ace of clubs, an ace of spades, an ace of hearts, a king of spades and a king of hearts.
- determine the theoretical and experimental probabilities (10 trials and 20 trials) of drawing two consecutive kings if the first card drawn is put back in the deck (independent events);
- determine the theoretical and experimental probabilities (10 trials and 20 trials) of drawing two consecutive kings if the first card drawn is not put back in the deck (dependent events).
Pose the following questions:
- Is the probability of drawing two consecutive kings higher in independent events or in dependent events? Why is this?
- How can you compare the experimental probabilities to the theoretical probabilities? How does the number of trials affect this comparison?
Activity 2: Compare Theoretical and Experimental Probabilities
Here are the theoretical and experimental probabilities (10 trials and 20 trials) of independent events. The activity consisted of determining the probabilities of drawing 2 consecutive blue tokens if the first token is put back in the bag. The bag contained 2 yellow tokens, 2 green tokens and 6 blue tokens.
Theoretical Probability
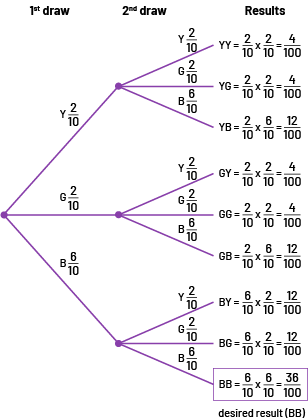 Image If on the first draw, there are two chances out of ten to draw a yellow chip, and on the second draw, there are two chances out of ten to draw a yellow chip, the result is: two out of ten multiplied by two out of ten equals four chances out of one hundred to draw two yellow chips. If on the second draw there are two chances out of ten to draw a green chip, the result is: two out of ten multiplied by two out of ten equals four chances out of one hundred to draw a yellow chip and then a green chip. If on the second draw, there are six out of ten chances of drawing a blue chip, the result is: two out of ten multiplied by six out of ten equals twelve out of one hundred chances of drawing a yellow chip and then a blue chip. If on the first draw there are two out of ten chances of drawing a green chip, and on the second draw there are two out of ten chances of drawing a yellow chip, the result is: two out of ten multiplied by two out of ten equals four out of one hundred chances of drawing a green chip then a yellow chip. If on the second draw there are two out of ten chances of drawing a green chip, the result is: two out of ten multiplied by two out of ten equals four out of one hundred chances of drawing two green chips. If on the second draw there is a six out of ten chance of drawing a blue chip, the result is: two out of ten multiplied by six out of ten equals twelve out of one hundred chances of drawing a green chip and then a blue chip. If on the first draw there is a six out of ten chance of picking a blue chip, and on the second draw there is a two out of ten chance of picking a yellow chip, the result is: six out of ten multiplied by two out of ten equals twelve out of one hundred chance of picking a blue chip and then a yellow chip. If on the second draw there are two chances out of ten to draw a green chip, the result is: six out of ten multiplied by two out of ten equals twelve chances out of one hundred to draw a blue chip and then a green chip. If on the second draw there are six out of ten chances of drawing a blue chip, the result is: six out of ten multiplied by six out of ten equals 36 out of one hundred chances of drawing two blue chips. This last equation is the only one of all the equations in the diagram that is framed.
Experimental Probability
Relative Frequency Tables
Draw 2 blue tokens in a row and put the first one drawn back into the bag (10 trials).
Results of the experiment: Y, BY, G, BB, BG, G, BB, Y, BY, BB.
| Combination of Tokens | Counting | Frequency | Frequency (Fraction) | Frequency (Percentage) |
|---|---|---|---|---|
| Y |
|| |
2 | \(\frac{2}{10}\) | \(\displaylines{\begin{align} \frac{2}{10} &= 2 \div 10 \\ &= 0.2 \\ &= 20 \% \end{align}}\) |
| BY |
|| |
2 | \(\frac{2}{10}\) | \(\displaylines{\begin{align} \frac{2}{10} &= 2 \div 10 \\ &= 0.2 \\ &= 20 \% \end{align}}\) |
| G |
|| |
2 | \(\frac{2}{10}\) | \(\displaylines{\begin{align} \frac{2}{10} &= 2 \div 10 \\ &= 0.2 \\ &= 20 \% \end{align}}\) |
| BB |
||| |
3 | \(\frac{3}{10}\) | \(\displaylines{\begin{align} \frac{3}{10} &= 3 \div 10 \\ &= 0.3 \\ &= 30 \% \end{align}}\) |
| BG |
| |
1 | \(\frac{1}{10}\) | \(\displaylines{\begin{align} \frac{1}{10} &= 1 \div 10 \\ &= 0.1 \\ &= 10 \% \end{align}}\) |
| Total | 10 | 10 | \(\frac{10}{10}\) | 100 % |
Note: In the tables, you must write the colour of the token drawn each time a first draw is made. If, on the first draw, a blue token is obtained, a second draw must be made. If a token of another colour is drawn, there is no need to draw another token, because it is already lost.
Draw 2 blue tokens in a row and put the first one drawn back into the bag (20 trials).
Results of the experiment: BB, Y, G, BB, BY, G, BG, Y, BB, Y, BG, BY, G, BB, G, BY, BB, Y.
| Combination of Tokens | Counting | Frequency | Frequency (Fraction) | Frequency (Percentage) |
|---|---|---|---|---|
| BB |
|||| ||| |
7 | \(\frac{7}{20}\) | \(\displaylines{\begin{align} \frac{7}{20} &= 7 \div 20 \\ &= 0.35 \\ &= 35 \% \end{align}}\) |
| Y |
|||| |
4 | \(\frac{4}{20}\) | \(\displaylines{\begin{align} \frac{4}{20} &= 4 \div 20 \\ &= 0.2 \\ &= 20 \% \end{align}}\) |
| BG |
|| |
2 | \(\frac{2}{20}\) | \(\displaylines{\begin{align} \frac{2}{20} &= 2 \div 20 \\ &= 0.1 \\ &= 10 \% \end{align}}\) |
| G |
|||| |
4 | \(\frac{4}{20}\) | \(\displaylines{\begin{align} \frac{4}{20} &= 4 \div 20 \\ &= 0.2 \\ &= 20 \% \end{align}}\) |
| BY |
||| |
3 | \(\frac{3}{20}\) | \(\displaylines{\begin{align} \frac{3}{20} &= 3 \div 20 \\ &= 0.15 \\ &= 15 \% \end{align}}\) |
| Total | 20 | 20 | \(\frac{20}{20}\) | 100 % |
Source: translated from En avant, les maths!, 7e année, ML, Données, p. 5-8.
Ask students to analyze and compare the theoretical and experimental probabilities of getting two consecutive blue tokens. Here are some sample questions to ask them to extend their reasoning:
- If you compare the experimental probability of getting two consecutive blue tokens after 10 trials with the probability after 20 trials, what do you notice?
- What do you notice when you compare the experimental probability of 10 trials and 20 trials with the theoretical probability?
- What do you notice if you add or compare the sum of the probabilities of the outcomes for each of the relative frequency tables with the tree diagram?
Encourage students to determine the theoretical and experimental probabilities (10 trials and 20 trials) of drawing two blue tokens if the first token drawn is not put back into the bag (dependent events). Ask them to compare the probabilities obtained with those previously calculated for the independent events.