B1.7 Describe relationships and show equivalences among fractions, decimal numbers up to hundredths, and whole number percents, using appropriate tools and drawings, in various contexts.
Activity 1: Area Model
Area models are very useful for showing the relationship between the fractions, decimal numbers, and whole number percents. For example, present the following scenario to students and ask them to answer the questions below:
16 of the 25 plots in one field are cultivated with wheat and 9 with barley.
- Represent the situation visually.
- Represent the situation symbolically.
- What decimal number and percent do the wheat plots represent?
- What decimal number and percent do the barley plots represent?
Interactive Lesson: translated from L'@telier - Ressources pédagogiques en ligne (atelier.on.ca).
Activity 2: Concentration
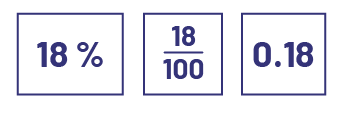
Group students in pairs and give each team 18 small blank cards. Ask them to make six sets of three cards, one should display a percent, one should display corresponding decimal fraction and one should display corresponding decimal number.
Example of a set of cards
Once the cards have been prepared, explain the Concentration game:
- All the prepared cards should be randomly placed upside down in a row and column grid. One partner will turn over three cards, trying to get a match. If the player succeeds, they get a point and can continue. If they fail, they turn the three cards over, and it is their opponent's turn to play. The game continues until all the cards are turned over. The player with the most points wins the game.
Invite teams to exchange sets of cards and play again.
Source: translated from Guide d’enseignement efficace des mathématiques de la 4e à la 6e année, Numération et sens du nombre, Fascicule 3, Nombres décimaux et pourcentages, p. 177.
Activity 3: What is the Criteria?
This activity integrates concepts in Number as well as in Data.
In order to be more effective in formulating survey questions, constructing various graphs, and managing data, students must learn to determine classification criteria.
To support students in developing this skill, teachers can show them a set of ten different objects and ask them to decide on criteria to classify them, challenging them to beyond colour and shape (which have been covered in previous grades). Students should divide the objects into subsets according to their classification criteria and determine the fraction of the original set represented by each subset (for example, many of the objects are made of plastic, which is equivalent to 0.3 or 30%). Classification of ten objects allows students to easily relate a number represented as a fraction, a decimal number, and a percent.
For example, present this set of ten objects: a tennis ball, a pencil, a water bottle, a highlighter, sticky notes, a pair of shoes, a sheet of paper, a calendar, a box of tissues, and a cup.
Ask them to create a classification criterion to create subsets, and then to determine the fraction, decimal number, or percent that the subset represents.
Examples could include:
- The pencil and the highlighter are both used for writing or drawing, so \(\frac{2}{{10}}\), 0.2 or 20% of the objects are used for writing or drawing.
- The sticky notes, the sheet of paper and the calendar are things we write on, so \(\frac{3}{{10}}\) or 0.3 or 30% of the objects are things we write on.
There are several other classification criteria such as texture, material of construction, mass, and utility. In the junior grades, the criteria do not have to be observable as are colour and size.
This classification activity can be repeated throughout the year with different objects which a group of students is responsible for choosing. The number of objects can increase to 20, 25, or even 50. Students apply equivalence relationships to determine fraction, decimal, or percent. For example, if 13 of the 20 objects are plastic, they can determine that \(\frac{{13}}{{20}}\), \(\frac{{65}}{{100}}\), 0.65 or 65% of objects are plastic; if 10 of the 25 objects or \(\frac{{10}}{{25}}\) objects are used for cooking, they can say that it is \(\frac{2}{5}\), 0.4 or 40% of the objects are used for cooking.
To extend the activity, a group of students can classify a set of objects according to a chosen criterion. For example, students can announce that \(\frac{4}{{10}}\) or 0.4 or 40% of the objects, namely the tissue box, the highlighter, the calendar, and the pencil have something thing in common. The other students then try to determine the criterion that was used to sort the objects. For example, all four of the objects have lettering. A variety of criteria are possible.
Source: translated from Guide d'enseignement efficace des mathématiques de la 4e à la 6e année, Numération et sens du nombre, Fascicule 3, Nombres décimaux et pourcentages, p. 116-117.